- 金币:
-
- 奖励:
-
- 热心:
-
- 注册时间:
- 2006-7-3
|
|

楼主 |
发表于 2009-3-22 15:29
|
显示全部楼层
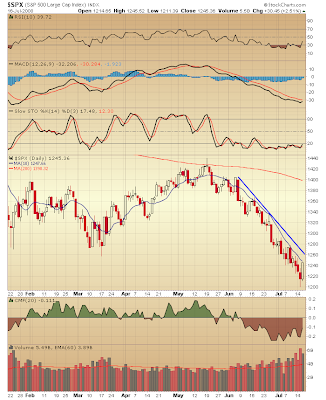
Tuesday, May 27, 2008Possible trend change
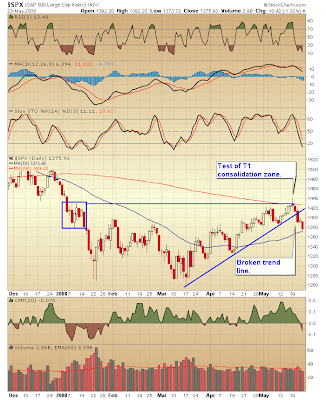 I've noted in the daily updates for a while the build in negative sentiment levels and now the S&P has broken the uptrend line. It has also tested the consolidation zone from the T1 move and failed. I think the odds are now in favor of a continuation of the bear market. I do think the market is going to bounce into the end of the month but I suspect that is just going to allow the shorts in at a better level. I also have a feeling that when and if the market approaches the Mar. lows Bernanke is going to flood the market with even more liquidity and put a floor under the market. I've noted in the daily updates for a while the build in negative sentiment levels and now the S&P has broken the uptrend line. It has also tested the consolidation zone from the T1 move and failed. I think the odds are now in favor of a continuation of the bear market. I do think the market is going to bounce into the end of the month but I suspect that is just going to allow the shorts in at a better level. I also have a feeling that when and if the market approaches the Mar. lows Bernanke is going to flood the market with even more liquidity and put a floor under the market.
Posted by Gary at 6:10 AM
26 comments Links to this post 
Thursday, May 22, 2008Leaving town
I'm off to Joshua tree for the long weekend. I'll be back Monday. Have a great holiday weekend, I plan to.
Posted by Gary at 4:12 PM
15 comments Links to this post
Wednesday, May 21, 2008Runaway move in the energy markets
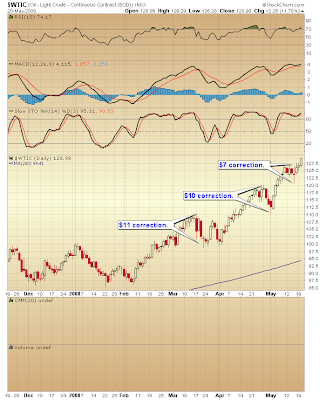
 The massive amount of liquidity the Fed has created as they try to prevent a recession before elections has now created a runaway move in the energy markets. So far each correction in oil has been slight, in the range of $11 to $7. Make no mistake when this parabolic move collapses it's going to be spectacular. The massive amount of liquidity the Fed has created as they try to prevent a recession before elections has now created a runaway move in the energy markets. So far each correction in oil has been slight, in the range of $11 to $7. Make no mistake when this parabolic move collapses it's going to be spectacular.
That being said no one in their right mind should be shorting this thing yet. A good rule of thumb is to be on the look out for a correction that exceeds the previous corrections by 20% before trying to call the top. That would work out to be roughly $13.50. Once oil corrects by at least that amount then we might be looking at the end of this move. Until that happens your odds of trying to pick the top of this move are not good.
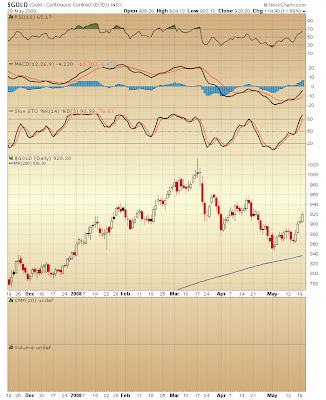
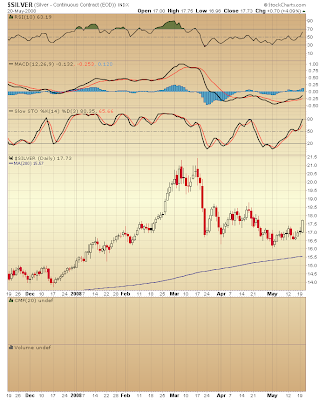
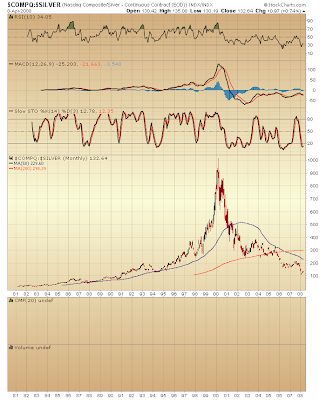
I've also included the charts of gold and silver. The Fed has flooded the world with so much liquidity that for the first time in this bull market a D wave decline was unable to push gold or silver back to the 200 DMA.
Posted by Gary at 10:04 AM
32 comments Links to this post
Tuesday, May 20, 2008The Fed is still hard at work
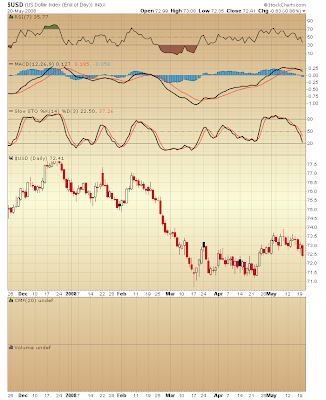 A month ago I was under the impression that the dollar was ready for the next counter trend rally in the ongoing bear market. It's definitely time. It's been over two years since the peak of the last rally. In that time the Fed has cost us 23% off the value of the dollar peak to trough. A month ago I was under the impression that the dollar was ready for the next counter trend rally in the ongoing bear market. It's definitely time. It's been over two years since the peak of the last rally. In that time the Fed has cost us 23% off the value of the dollar peak to trough.
Unfortunately the dollar is starting to look like it's ready to roll over again. It seems the Fed is still hard at work devaluing our currency. The actions of this Fed are really starting to worry me. They apparently have no concern for inflation.
Obviously all that matters is to rescue the financial system no matter what the cost to the rest of us. If the dollar breaks to new lows I hate to think what commodity prices are going to do, especially oil and gasoline.
Posted by Gary at 5:56 PM
7 comments Links to this post
Monday, May 19, 2008Has Gold's A wave begun?
 I've mentioned in the past that I think the fun part of the Fed's monetary inflation is now over. The US is entering the time when the Fed's loose monetary policies are going to start causing pain. Probably a lot of pain. I've mentioned in the past that I think the fun part of the Fed's monetary inflation is now over. The US is entering the time when the Fed's loose monetary policies are going to start causing pain. Probably a lot of pain.
We've hit the point in the road where the fundamentals are going to take over and move markets where they must go.
Over the last two months we've been privileged to be schooled by countless anonymous posters who are sure that gold and commodities in general are going to collapse. They've repeatedly pointed to the bear market of the 80's and 90's as proof that this is so. Most think commodities are in a bubble. I guess after watching the last three bubbles the Fed has created it's understandable. However just because prices are rising doesn't imply a bubble. For a bubble to form you must have oversupply.
I've occasionally tried to explain that markets work in cycles and that commodities, because of supply and demand fundamentals, are no longer in a long term bear market with as you might guess little success.
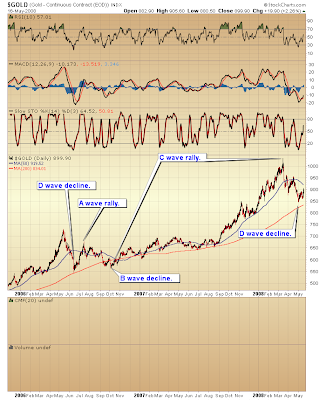
Now I think there's a very good chance that Gold's A wave has started. Look at the chart and you will get a picture of the last complete cycle in gold. A waves rarely take gold to new highs. So I expect gold to test the lows again later in the summer. That will be the next great buying opportunity in the PM.
A waves can be explosive but investors probably shouldn't get married to the idea that gold is going straight to $1500.
Posted by Gary at 6:29 AM
56 comments Links to this post
Friday, May 16, 2008Those darn funnymentals
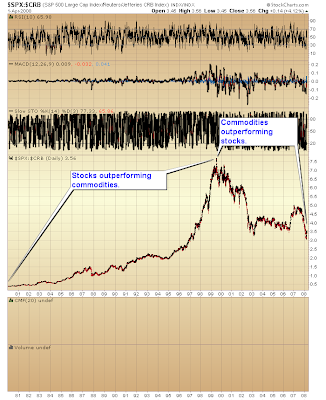
As I write this gold is up another $14 and oil is up $3. Many technicians will of course tell us the fundamentals don't matter. Personally I pay attention to both the fundamentals and the charts. In the short term fundamentals aren't going to influence day to day movements. The fundamentals however over the longer term are going to move the market in the direction it has to go. Case in point the commodity bull market since 2001. Fundamentals are more like a rising tide. You can swim against it for a while but you can't prevent it from coming in.
My theory is that this rally is nothing more than a blizzard of paper being created by the Fed to keep the markets levitated until the elections, which seems to be working BTW.
Unfortunately this is also preventing over stretched commodity markets from correcting.
I'm watching the dollar closely now. We are in the window of time when we could and probably should see the second counter trend rally in the dollar bear market. However if the Fed is creating too much liquidity for this to happen then the risk of the dollar rally failing is high. The fundamentals will eventually take the market were it has to go regardless of what the charts say.
Fundamentally, if there are just too many dollars floating around then the rally is doomed to failure. If this does unfold I hate to think where commodity prices are going.
Expect to see more media hype about evil oil companies and hedge fund speculation. I also expect to see margin requirements increased in the futures markets and perhaps we will see another round of index reweightings similar to the Goldman gasoline reweighting in 06.
I expect the powers that be will try any and everything to abort the stagflation outcome of the 70's from repeating. Heck they already measure inflation by removing everything that's inflating. It's a good start unfortunately it doesn't jive with reality.
Following down the same monetary inflation path as the 70's is going to ultimately lead to the same outcome as before no matter what new tricks and gimmicks the Fed tries.
Posted by Gary at 5:34 AM
49 comments Links to this post
Thursday, May 15, 2008Will a recession mark the end of the commodity bull?
Seems like the current thought amongst most investors is that a recession will put an end to the commodity bull market. Seems reasonable doesn't it? If the economy slows or shrinks commodity demand will contract. Falling demand equals lower prices right?
Now let's look a little deeper into that theory shall we.
First off let me clear up one critical point. Commodities have been in a secular bull market for the last 7 years for one reason and one reason only. Supply and demand imbalance. This goes back to our original question of will a recession cure the commodity price explosion.
Let me point out another important fact. Recessions don't last forever.
Now let's examine what is going to happen if the recession worsens and commodity prices fall.
If prices are falling rapidly does anyone seriously think oil companies, copper miners, gold and silver miners, farmers, etc. etc. are going to continue to rapidly expand production or exploration?
I can guarantee you they won't. They all remember the bear market years from 80-2000. Heck anons come on this blog daily to remind us of those times. No what's going to happen is commodity companies are going to start tightening their belts again and put expansion projects on hold waiting to see what unfolds.
The end result is as the economy comes out of recession and commodity demand surges again new supply will not be coming online. As a matter of fact new supply would now have been delayed even further down the line.
Now do you see why commodity bull markets last so long. Rising commodity prices tend to slow or stagnate economies. When this happens it just serves to slow the production of desperately needed new supply.
A serious recession will only guarantee much higher commodity prices in the future.
Posted by Gary at 6:29 AM
13 comments Links to this post
Newer Posts Older Posts Home
Subscribe to: Posts (Atom) |
|
|
 [复制链接]


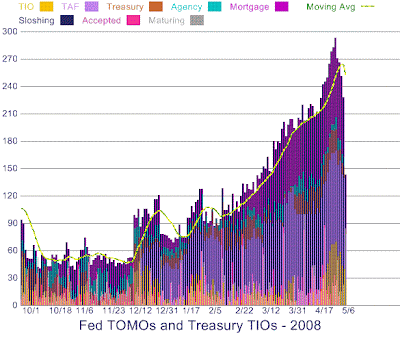 I'm going to be watching the TOMO, TIO and TAF auctions in the coming weeks. Since Oct. the level of temporary loans has risen from 40 billion to almost 300 billion. The Fed is flooding money into the system. Will this be enough to push the market thru resistance? I don't know. It appears that they are willing to print how ever much money it takes though to accomplish the job. With oil bouncing off $110 support they still have an inflation problem though. So do they risk spiking oil even higher to inflate the market? Long term tenet #1 says that yes they will.


 Often when the daily noise gets confusing it's helpful to step back and look at the long term perspective. In the first chart we see the S&P. Notice that during the entire bull market the corrections were fairly uniform. 7-10% was the norm for every correction on the way up. Once this bull market became mature any correction that exceeded that norm would likely be a sign that the bull was done. We saw that correction in Jan. once the S&P dropped over 13%. Looking at the long term view of the general stock market one has to say we are in a bear market until proven otherwise.


