搜索
楼主: hefeiddd

一个笨蛋的股指交易记录-------地狱级炒手

  [复制链接]
 楼主| 发表于 2009-4-2 17:39 | 显示全部楼层
June 06, 2004ENERGY STOCKS MAY BE TOPPING By Chip Anderson
John Murphy
One of the principles of intermarket behavior is that commodity-related stocks usually peak before the commodity. That's why the next chart is so interesting. While energy prices hit a record high early this week, the Energy Select Sector SPDR peaked in late April. That created a negative divergence with the rising commodity. The three peaks formed since early March also have the look of a potential "head and shoulders" top. To confirm that bearish pattern, however, the XLE would have to break the "neckline" drawn under the March/May lows. The relative strength line has been dropping for three weeks and is testing the up trendline starting in February. A break of that line would be a negative sign for the energy sector.


Posted by Chip Anderson at 4:01 PM in John Murphy | Permalink


June 06, 2004Hello Fellow ChartWatchers! By Chip Anderson
Chip Anderson
Last week saw the major markets put in another "lower high" for the current downtrend - the third major one since things started moving lower back in March. This three-point downtrend is easiest to see on the Nasdaq's chart, but it appears on most of the other major charts to one degree or another. Here's a new "behind" chart (discussed in our last newsletter) that shows the three-peak downturn for the majors:
Later in this issue, John Murphy looks at Energy stocks, Carl discusses NYSE Member Buying, Arthur Hill is bullish based on Elliott while his friend Richard Rhodes expects a pull-back.
MORE SHARPCHARTS2 TIPS AND TRICKS
Let's look at a long-term chart of the S&P 500 using some of the new tools that are available to us via the SharpCharts2 Beta workbench. Here's a weekly chart of the index going back to mid-2002:
Above the chart is a standard MACD display showing that the weekly MACD histogram went negative back in March for the first time since late 2002.
"Behind" the price bars (in blue) is the S&P 500 Bullish Percent index ($BPSPX) - a market indicator based on the P&F charts of all of the stocks that make up that index. Notice how it's movements "mimic" the movements on the prices bars up until February, 2004? Since then, it has moved lower while the index has moved sideways. This kind of bearish divergence hints at hidden weakness inside the index that is being masked by strength in a small number of components.
On top of the price bars is a standard Bollinger Band display and, below the chart, is the BBand Width display. Notice that the BBWidth is at its lowest point on the chart right now. That means that the index has been moving "sideways" (relatively speaking) for quite some time now. This is also confirmed by the low ADX reading. Also notice that the red "-DI" line (indicating a downtrend) moved above the green "+DI" line for the first time in a year at the start of May.
All-in-all, a picture of weakness for the S&P 500 and a great example of the kind of composite charts that our new SharpCharts2 workbench can deliver.


Posted by Chip Anderson at 4:00 PM in Chip Anderson | Permalink


May 14, 2004VOLATILITY INDICES BREAK 200-DAY SMA’s By Chip Anderson
Arthur Hill
Although there is more than one way to interpret volatility, the simple fact is that the S&P 100 Volatility Index (VIX) and the Nasdaq 100 (VXN) trend lower when the market trends higher and trend higher when the market trends lower. In other words, these indicators actually trend and move inverse to the underlying indices.
VXN broke below its 200-day SMA in Dec-02 and remained below for over a year. Similarly, VIX broke below its 200-day SMA in Mar-03 and remained below for almost a year (red arrows). These breaks coincided with a strong and sustainable uptrend that lasted from Oct-02 to Jan-04 in NDX and from Mar-03 to Mar-04 in SPX.
A little intuitive reasoning would suggest that upside breakouts in VIX and VXN would be bearish. VIX is leading the way higher with its second break above the 200 day SMA in three months. VXN was turned back at the 200-day SMA in March, but broke above with a gap higher on Tuesday (red arrows).
Contrarians may argue that more fear is actually bullish. However, it is also abundantly clear that the OEX and NDX move inverse to VIX and VXN. As fear increases so does selling pressure and this drive stocks lower. An important trend change appears to be afoot in these volatility indices and this is likely to adversely affect on stocks.


Posted by Chip Anderson at 4:05 PM in Arthur Hill | Permalink


May 14, 2004LOOKING FOR A BOTTOM IN GOLD STOCKS By Chip Anderson
Carl Swenlin
At the end of April the XAU monthly Price Momentum Oscillator (PMO) -- not shown here -- topped at very overbought levels, rendering a long-term sell signal. This action confirmed the sell signal top on the weekly PMO a month earlier, shown on the chart above. Both the monthly and weekly PMO can issue long-term signals, but the monthly PMO is much more serious.
Nevertheless, the weekly PMO shows that the longer-term overbought condition has been relieved, and the daily PMO (not shown) is becoming overbought, so we should be looking for a bounce from around the rising trend line support at 75 or 70. I think it will probably be a strong rally, and may even turn the monthly and weekly PMOs back up, but, in my opinion, sentiment is not yet as bad as it ought to be in order for gold stocks to put in a bottom. I base this opinion upon Rydex Precious Metals Fund net cash flow, which still doesn't reflect the degree of capitulation that we ought to see, considering how badly prices have been hit.
Rather than trying to catch a falling knife, I think that waiting for the weekly PMO to bottom (on a weekly closing basis) will provide a margin of safety for those wanting to trade the next rally.
To learn more about Decision Point's PMO click here.


Posted by Chip Anderson at 4:04 PM in Carl Swenlin | Permalink


May 14, 2004TAKING ADVANTAGE OF WEAKNESS IN BONDS By Chip Anderson
Richard Rhodes
The recent capital market turmoil across the oceans and through all asset classes be it bonds or stocks or gold, has exacerbated certain risk-reward relationships between these asset classes as the "carry trade" is being unwound. And while these relationships may become even "more skewed" in the weeks and months ahead - we believe the time is approaching whereby asset allocators will begin to favor bonds over US stocks. Increasingly, this relative valuation will come to bear upon investment gains...and must be exploited as the next larger picture trade for the coming year.
That said, our proxy for this relationship is TLT vs. SPY (Lehman 20+ yr. Bond Fund vs. the S&P 500 Index), which allows us to exploit relative gains using equities only. Since March-2003, prices moved lower in a very distinct downtrend - forming a declining wedge pattern that shows each successive low is losing momentum. And while no major levels of resistance have yet been violated - the pattern appears ready to conclude is slide and resume its upward trajectory. Thus, we would become interested in "speculatively" purchasing the ratio upon a move above the .75 to .77 level from its current .74 trough, which may develop in the days or weeks ahead given the negative divergence forming between prices and the stochastic.


Posted by Chip Anderson at 4:03 PM in Richard Rhodes | Permalink


May 14, 2004BIG SAVINGS FOR MURPHY SUBSCRIBERS By Chip Anderson
Site News
MURPHY MARKET MESSAGE SUBSCRIBERS SAVE AN ADDITIONAL 10%! - Starting this week, subscribers to John Murphy's Market Message receive an additional 10% off of any and all purchases made in the StockCharts.com bookstore. Depending on what you order, that means that your Murphy Membership could pay for itself! This is not a limited time offer. This discount is available for as long as you are a Market Message subscriber AND you can use this discount on anything in the bookstore - even sale items! To get started, simply log in to your Murphy account by clicking on the "John Murphy" tab at the top of our homepage. Look for more instructions on the right side of the "John Murphy" page.
OVERLAYS ARE ONLINE! - SharpCharts 2 Beta 4 was released last week and it includes support for overlaid charts. For more details, see Chip Anderson's article above.
A.M. VOLUME DISCREPANCIES - As part of our transition to the new data feed that we mentioned last week, we are currently experiencing some volume discrepancies during the first two hours of trading. During those times, the daily volumes reported by our site are lower than the actual volumes reported by other sources. The problem is corrected automatically around 1PM Eastern each day. We are working hard with our data vendor to eliminate this problem but it may be mid-week before a solution can be put into place. We apologize for any inconvenience this may cause.


Posted by Chip Anderson at 4:02 PM in Site News | Permalink


May 14, 2004SURPRISED BY SURPRISED ECONOMISTS By Chip Anderson
John Murphy
CPI AND PPI NUMBERS SURPRISE ECONOMISTS... The most frequently seen words in the financial press are "economists were surprised". It seems they're always being surprised by something. This week it was the "surprising" jump in the CPI and PPI inflation numbers. The fact that economists were surprised is a story in itself. It shows what happens when people ignore the clear messages being sent by the financial markets. And when they ignore the obvious. Take commodity prices for example.
The CRB Index has been rising for two years and recently reached the highest level in a decade. Rising commodity prices are a leading indicator of inflation. One of the reasons for that is because companies have to pay for rising raw material prices. In time, they have to start passing those increased costs on to their customers. It's simple economics -- and common sense. An increasing number of companies have announced planned price increases to no one's surprise but economists.
For months, economists have been dissecting rising inflation numbers to exclude surging food and energy costs -- as if they don't count in the inflation picture. Now with gasoline and crude oil prices trading at record highs, they've suddenly started talking about the inflationary impact of rising energy prices and the potential dampening effect that has on the economy and the stock market. Where have they been for the last few months as the market deterioration sent the same message. Long-term rates have jumped to the highest level in almost two years. Here again, economists told us there was no problem there because there was no sign of inflation. This week they suddenly started to take notice. That's why we look at forward-looking markets and not backward-looking economic numbers.
Now, the only one left to convince is the Fed. Trouble is the Fed is populated by economists.


Posted by Chip Anderson at 4:01 PM in John Murphy | Permalink


May 14, 2004Hello Fellow ChartWatchers! By Chip Anderson
Chip Anderson
At the height of last Wednesday's big decline all of the major averages except one had moved below their 200-day (40-week) moving averages. This was the first time that had happened since the start of 2003 and it is another important technical milestone that occurs as a significant uptrend turns into a significant downtrend. First the 50-day MA is broken, then the 50-day MA starts moving lower, then the 200-day MA is broken, and finally the 200-day MA starts moving lower.
Each of those milestones is important and watched closely by the market. Don't believe it? As soon as the S&P 500 moved below its 200-day MA on Wednesday, the market started rallying. Money managers said to themselves "Things have fallen enough, let's start buying some bargains." Wednesday's afternoon rally (+196 points on the Dow) erased the morning's losses, but the psychological technical "damage" remained. Having broken the 200-day MA once recently, the market may not be in such a buying mood the next time it happens.
Later in this issue, John Murphy, Carl Swenlin, Richard Rhodes and Arthur Hill provide even more reasons for using Technical Analysis, but first...
GETTING AHEAD WITH "BEHIND"
One of the best parts of my job is introducing you to important new features that we've added to StockCharts.com. Last week, we quietly added one of the best new features ever - overlaid charts. Overlaid charting allows you to place the chart from two or more ticker symbols or indicators on top of each other on the same chart. You can find this new feature in the "Beta 4" version of our new SharpCharts 2 charting engine.
To create an overlaid chart, simply select "Behind" from the dropdown located to the left of any of the "slots" in the "Indicators" area below the chart. Before now, you could only select "Above" or "Below" from that dropdown. The addition of "Behind" opens up whole new worlds of charting possibilities. Here are some examples:
Comparing a Stock's Price Movements to an Indicator's Signals:
Here we have the 28-day William's %R overlaid (underlaid?) with the Qs. This chart shows you quite clearly how the indicator has moved into the overbought and oversold areas ahead of significant reversals by the stock in late 2003 as well as in March 2004.
Note: The vertical scale for QQQ is on the right, the vertical scale for William's %R is on the left.
Comparing a Market Index to several Market Breadth Indicators:
Here we see the NYSE Composite Index in blue, the cumulative NYSE Advance-Decline Line in black, the NYSE McClellan Oscillator in red, and the NYSE New Highs-New Lows in green. Notice how, at the start of April, the McClellan Oscillator (red) turned lower before the other indicators did?
Note: Right now, overlaid indicators can only appear in "Line" mode. In order to chart the Advance-Decline line in Cumulative mode, I have to make it the "primary" ticker symbol for the chart. The other lines were added to the chart using the new "Price" indicator and the new "Behind" position setting.
Intermarket Analysis:
Here's a chart that John Murphy followers will love - the four major Intermarket indices overlaid all on one chart. While we still recommend using our interactive PerfChart to perform Intermarket analysis, this chart can also shed light on the topic. For instance, the recent weakness in bond prices really stands out here.
Overlaid charting opens up a whole new world of possibilities for your analysis. Watch out for even more features to appear over the next month or so. In the mean time, please give "Beta 4" a try and use the Feedback link on that page to let us know what you think!


Posted by Chip Anderson at 4:00 PM in Chip Anderson | Permalink


May 01, 2004NASDAQ FAILING AND INDICATORS CONFIRMING By Chip Anderson
Arthur Hill
There are three ingredients to a downtrend: lower high, lower low and trendline break. The final ingredient (trendline break) is open for debate, but the lower low and lower high are not. With this week’s failure to hold the big gains above 2030 (22-Apr) and break below the 1978, the Nasdaq is well on its way to a trend change. The index formed another lower high below 2100 (black arrows) and broke below the trendline extending up from March 2003. Two of the three ingredients for a trend change are in place and a move below the March low (1898) would solidify the reversal.

In addition to the actual price chart, key indicators confirm recent weakness and point to further downside. MACD moved below its signal line and into negative territory. This bearish signal is confirmed by On Balance Volume (OBV), which moved to an 11-month low (red arrows). These indicators are not correlated and this makes confirmation all the more significant. Notice that MACD moved into negative territory in November and December, but this was not confirmed by On Balance Volume (OBV), which held above its prior lows and continued higher (gray arrows).

This was an excerpt from the weekly TDT Report. The remainder is reserved for subscribers and includes a look at sector weightings within the S&P 500, analysis of the top six sectors (SPDRs), identification of the two biggest culprits, analysis of the S&P 500 and the weekly Model Portfolio.


Posted by Chip Anderson at 4:05 PM in Arthur Hill | Permalink


May 01, 2004S&P 500 NEW HIGHS AND NEW LOWS By Chip Anderson
Carl Swenlin
Here's a new chart we've just deployed on DecisionPoint.com, showing the 52-week new highs and new lows for just the stocks in the S&P 500 Index. I think this is useful because it shows what is happening with the stocks in the world's most "indexed" index. I have been collecting this data since 2001, but I have never seen it on a chart before. The most surprising aspect to me was that there were not more new lows in 2002 as the market was putting in a bottom, but I assume this is due to the high sponsorship of these stocks.
Currently, the most obvious feature is the sharp contraction of new highs over the last few months, even as the price index has been bumping along near bull market highs. This is a negative divergence and doesn't bode well for the market this late in the bull run. There has been some expansion of new lows, but nothing to compare to the recent 200 new lows on the NYSE (a reflection of what is happening to interest rate sensitive issues on the NYSE that are not common stocks).


Posted by Chip Anderson at 4:04 PM in Carl Swenlin | Permalink


May 01, 2004CONSOLIDATION OR DISTRIBUTION? By Chip Anderson
Richard Rhodes
Over the course of the past 4-months, price action in all of the indices have been "locked" within wide trading ranges. One question to be be answered is whether this is a "consolidation" to new highs; or a "distribution" to lower lows. If we had to answer this - we would suggest that against the fundamental backdrop of higher interest rates - the financial system has begun "DELEVERAGING" itself from the "carry trade" estimated to be $1.5 trillion. Therefore, we can conclude this trading range is a distribution formation...of which lower prices are developing.

But just as importantly, we must look to "style type" decisions for trading, of which the ratio chart between the SP 500 Large Cap vs. SP 600 Small-Cap is locked within a clear downtrend. However, nascent signs are developing that the outperformance of the SP 600 is coming to a close in the intermediate-term. The ratio is on the verge of breaking above trendline resistance, which would then prompt a move into the 80-week moving average...and quite possibly the previous highs near 4.75. Be prepared.


Posted by Chip Anderson at 4:03 PM in Richard Rhodes | Permalink
金币:
奖励:
热心:
注册时间:
2006-7-3

回复 使用道具 举报

 楼主| 发表于 2009-4-2 17:40 | 显示全部楼层
May 01, 2004CHART OVERLAYS COMING THIS WEEK By Chip Anderson
Site News
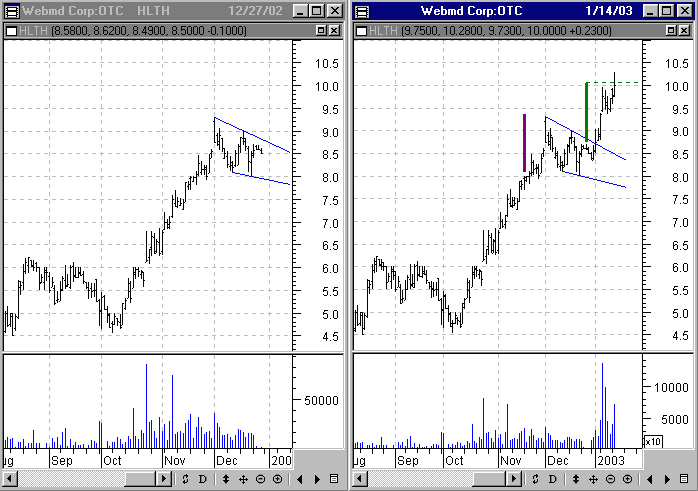
MURPHYMORRIS.COM TRANSITION COMPLETE - We have moved all of the MurphyMorris.com content from that website into the "John Murphy" section of StockCharts.com now. Subscribers to the Murphy Market Message should now click on the "John Murphy" tab at the top of our pages to see John's latest market commentary. John's charts look better (see above for two examples) and we've added a calendar of John's upcoming appearances as well. Look for us to add more features and specials to the Murphy area in the coming months.
LOOK FOR CHART OVERLAYS LATER THIS WEEK - We're putting the finishing touches on a major new feature of our new SharpCharts2 charting engine right now - Chart Overlays. This feature allows you to place two charts "on top of each other". For example, you could place a plot of a stock's MACD indicator behind the actual candlesticks of the stock itself so you could directly compare the MACD's signals with the stock's turning points. Or, by using our new "Price" indicator, you can plot one stock's price onto of another stock's chart! Here's an example of that using the Nasdaq and the VIX:

The key to using this new feature will be a new choice in the "Position" dropdown box for each indicator. Right now, you can choose to place an indicator "Above" or "Below" the chart. Soon, you will also be able to place an indicator "Behind" the chart as well!

We expect to have this new capability available later this week when we update the SharpCharts2 Beta page with the "Beta 4" version. Watch the "What's New" section of the web site for the official announcement.

PREPARING FOR A NEW DATAFEED - I wanted to tell you about a behind-the-scenes change that we are about to make that - hopefully - will be invisible to everyone. Our data vendor, Thomson Financial, is replacing our current data feed with their new "top-of-the-line" data feed called "ThomsonOne". ThomsonOne is faster, more reliable, and more comprehensive than the data feed we are currently using and so ultimately, this change will result in much better charts for everyone. Thomson and StockCharts have been working for over a year getting ready for this change and trying to make sure that it occurs smoothly, however experience tells us that no matter how much we prepare, minor glitches may still happen during the transition period. We apologize in advance for any inconvenience this change may cause and promise that we will be working very hard to find and fix any and all issues that arise as quickly as possible. We expect the transition to occur gradually between now and the end of June. I'll keep you updated on our progress in future newsletters.


Posted by Chip Anderson at 4:02 PM in Site News | Permalink


May 01, 2004A-D LINE TURNS DOWN By Chip Anderson
John Murphy
LOWEST LEVEL IN MONTHS... It's been awhile since we've talked about the Advance-Decline lines in the various markets. The two charts below show why we're showing them now. The NYSE Advance-Decline line has fallen to the lowest level in four months. This is its weakest showing since the market rally started last March. The Nasdaq AD line looks even worse and has broken its 200-day moving average. That confirms that most of initial technical damage came from the Nasdaq. Trouble is it's now spreading to the rest of the market. All the more reason to be defensive at this point.


Posted by Chip Anderson at 4:01 PM in John Murphy | Permalink


May 01, 2004Hello Fellow ChartWatchers! By Chip Anderson
Chip Anderson
Rolling over. The short term technical picture shows the markets rolling over right now into a new down leg. The key test will be when the Nasdaq tries to move below 1900 this week. Right now, most technical signals point to much lower prices if that occurs. John Murphy and Arthur Hill have more on the possibilities later on. But first...
SCANNING FOR CHANNELS - TAKE 2
Last issue, I showed you several techniques for creating scans that find stocks that have been moving sideways in a channel between two fixed price levels. But what about stocks that are moving sideways between other price levels? If you're scan is looking for stocks that are stuck between 30 and 40, you won't find stocks that are moving sideways between 80 and 90. Depending on what kind of trading you want to do, that can be a big problem.
The solution is to use percentage-based channels instead of fixed-price channels. A percentage-based channel scans looks for stocks whose maximum high is within a certain percentage (5% for example) of its minimum low for a given period of time. For example, using our Standard Scan interface, you'd create a scan that looks like this:
Notice the "1.05" in the Multiplier field? That's how we indicate that we want to find stocks that have been moving within a 5% channel. If we wanted to use a 2% channel instead, we would enter "1.02" into the Multiplier field.
While that scan will do the job, there's still a problem. It turns out that lots of very low volume stocks get returned by percentage-based channel scans. To eliminate those stocks from the scan, we can add another filter that ensures the Minimum Volume for the same period is greater than zero. Here's the final version of our scan:
THE "WITHIN" PROBLEM
Scan Engines are designed to find charts with a specific set of technical criteria on a specific date. Occasionally, we get a question from someone who is trying to use the scan engine to find stocks with a specific set of technical criteria over a range of dates. We call this the "within" problem since they are looking for something that happened "within" a certain time period. For example, "Show me all the stocks that had a MACD crossover within the past month."
The reason our scan engine doesn't support these "within" scans is because you cannot use them in a real-world trading environment. From a high-level perspective, the purpose of scanning is to develop scans that can help you decide which stocks to buy or sell "soon" - i.e. before the data used in the scan changes significantly. The standard scenario is to run your scans after the market closes in preparation for placing orders early the next day. While some of the results from a "within" scan may still be valid, others results may have become invalid by the time the scan is run and, what's worse, you cannot easily tell which is which.
We strongly recommend refining a "within" scan so that it refers instead to "today". For example, take the scan above and turn it into "Show me all the stocks that had a MACD crossover today." You can then use the "Starting" field (at the top of our scan interface pages) to see the results of the scan on any previous day you choose.
Again, the message here remains the same - when scanning, start simple, follow the examples, and experiment. Learning to use scans effectively is not that hard, but it does take time and effort. The rewards can be substantial however so stick with it and let us know how it goes!


Posted by Chip Anderson at 4:00 PM in Chip Anderson | Permalink


April 17, 2004NASDAQ AND OBV By Chip Anderson
Arthur Hill
On Monday we were focused on the pennant consolidation with support at 2038 and resistance at 2080 (gray oval). While these are typically bullish continuation patterns and an upside breakout was expected, it was prudent to wait for confirmation. Instead of the expected, the break came to the downside and the index has moved into corrective mode. A 50-62% retracement of the prior advance (1896 to 2080) would extend to the 1970-1990 area and broken resistance turns into support around 2000. A move below 1970 would be more than just a normal correction and suggest that a bigger decline may be ahead.
On Balance Volume (OBV) was developed by Joe Granville in the 70’s and is as simple as it gets. Volume is added on up days and subtracted on down days. The concern here is the relatively high volume on down days and the relatively low volume on up days over the last few months. With the decline from late January to late March, OBV moved below its December, September and August lows (red arrow) as selling pressure intensified significantly. The late March/early April bounce is a start, but it would take a move above the early April high to get OBV back on the bullish track.
This was an excerpt from the TDT Report, published every Friday. The remainder includes a primer on measuring relative strength, an application of relative strength to the HealthCare SPDR (XLV), a look at gold/XAU with the US Dollar Index, Elliott Waves applied to the S&P 500 and a Model Portfolio update.


Posted by Chip Anderson at 4:05 PM in Arthur Hill | Permalink


April 17, 2004RYDEX PRECIOUS METALS FUND NET CASH FLOW SPELLS TROUBLE AGAIN By Chip Anderson
Carl Swenlin
DecisionPoint.com tracks net cumulative cash flow of Rydex mutual funds as a way of estimating sentiment in various sectors. The theory is that money 'ought' to follow prices, more or less. In the last several months this indicator has been rather helpful in identifying problematic price moves by the appearance of price/cash divergences.
On the above chart of Rydex Precious Metals Fund, I have highlighted the first divergence with red circles. Note how there was virtually no cash flow supporting the advance into the January price top. An indication that the advance would fail. Next the blue circles show a blowoff move in February. Lots of money moved into the fund, but prices failed to respond positively enough. Again, an indication that the advance would fail.
Now we see a precipitous drop in prices, highlighted by the green circles; however, note that a proportionate amount of cash has not yet fled the sector. To me this indicates an unrealistic optimism, and my conclusion is that prices will have to drop farther in order to increase bearish sentiment to appropriate levels.


Posted by Chip Anderson at 4:04 PM in Carl Swenlin | Permalink


April 17, 2004ROTATION FROM TECH TO HEALTHCARE SECTORS By Chip Anderson
Richard Rhodes
This past week brought in "clear view" the under the surface rotation that has been occurring from the technology sector into the healthcare/pharmaceutical sector - and thus we think it important to look at the Pharmaceutical/Semiconductor RATIO. That said, this "repositioning" is extremely important in our overall equity viewpoint; in the past it has coincided with significant shifts in the overall sentiment of stocks to defensive or negative - as a change in risk aversion develops.
This point is quite clear at the Sept-1998 peak, at the Feb-2000 low, and at the Sept-2002 high - each corresponding with a change in trend for the stock market. Hence, we find it extremely important at this point given it is nearly universally thought that stocks correcting to move higher. If this pattern holds, and it still is not clear - then a topping pattern of proportion is developing...that could last several years if past patterns hold.
The bottom line - if you are long - you want to be cautious and consider defensive issues; and if you are inclined to be short...then technology rallies are to be sold, and to be sold aggressively.


Posted by Chip Anderson at 4:03 PM in Richard Rhodes | Permalink


April 17, 2004MURPHYMORRIS.COM CLOSING By Chip Anderson
Site News
MURPHYMORRIS.COM CLOSING SOON - Sometime in the next couple of days, we expect to complete the transition of John Murphy's tools and commentary from the "Members" tab on the MurphyMorris.com website to the "John Murphy" tab on the StockCharts.com website. For sometime now, the same content has been available on both sites - soon it will only be available on the StockCharts.com website. If you've been using the MurphyMorris.com website to access John's materials, you'll need to update your bookmarks once that transition is complete. Why not do it now?
At the same time, we'll be rolling out a better design for John's materials on the StockCharts.com site. Market Message Members have raved about how much better John's newsletter looks on the StockCharts.com site (here's a sample). Soon, all of John's pages will have that clean, neat look. Stay tuned...


Posted by Chip Anderson at 4:02 PM in Site News | Permalink


April 17, 2004THE DRG/SOX RATIO By Chip Anderson
John Murphy
DRG/SOX RATIO IS RISING... Earlier in the year I did an analysis of the DRG/SOX ratio as a way to try to measure the mood of the market. The ratio divides the Drug Index (DRG) by the Semiconductor (SOX) Index. The idea is that when investors are confident they buy chips and sell drugs. That pushes the ratio lower. That's what happened during October of 2002 when the market bottomed (see green circle). The downtrend in the ratio continued until last November when it started bouncing (blue circle). Its been trading sideways since then as the market rally has stalled. When investors turn more cautious, they sell chips and buy the more defensive drugs. That pushes the ratio higher. The DRG/SOX ratio is approaching the top of its six-month range and is close to moving above its 200-day moving average for the first time since last spring. The ratio has already broken its eighteen-month down trendline. An upside breakout in the DRG/SOX ratio would, in my opinion, signal a significant shift to a more defensive market mood. The two main reasons for that are rising energy prices and rising interest rates. That also explains why investors are selling rate sensitive stocks and buying energy. None of these rotations are good for the market as a whole.


Posted by Chip Anderson at 4:01 PM in John Murphy | Permalink


April 17, 2004Hello Fellow ChartWatchers! By Chip Anderson
Chip Anderson
All-in-all, last week was a down week for the major market averages. While the Dow managed to eek out a tiny gain, the other indices fell with the Nasdaq (-2.79%) leading the way. So far this year, the energy-heavy Amex Composite (+5.64%) and the Russell 2000 (+4.75%) are outpacing the other markets with the Nasdaq off 0.38% and the Dow essentially where it began the year.
"Change" appears to be the theme for this week's edition. John and Richard both look at changes that are underway in the sector picture, Carl has indications that change is coming to the Precious Metals sector, and Arthur looks at changes in the Nasdaq's OBV chart. But first, I hope to "change" your approach to scanning...
SCANNING FOR CHANNELS
In the past, I've written articles on scanning for Divergences, Cross-Overs, and P&F Signals. This week I'd like to demonstrate how one goes about scanning for Channels. A Channel is a pattern where a stock has been moving sideways within a given range for a given period of time. In the example below, DELL has been moving sideways between 30 and 40 for over 6 months.
In order to scan for stocks in a channel, you have to decide up front what the upper and lower bound of your channel will be along with minimum the length of time that a stock has to remain within that range. Let's see if we can find other stocks that have been bouncing within the same 30-40 channel that DELL has been in for at least 6 months. We can use the Standard Scan Interface for this (I recommend always using the Standard Scan Interface whenever possible). The "secret" to creating this kind of scan is to use the "Max. High" and "Min. Low" functions. Each one takes a single parameter which is the number of periods (days or weeks) to look back. Here's what the completed scan looks like:
The key lines are in the "Additional Technical Expressions " section. The first line makes sure that we only look for stocks that have not risen above 40 during the past 6 months (= 6 x 4 = 24 weeks = 24 x 5 = 120 days). The second line checks to see that we only find stocks that have not fallen below 30 during those same 6 months.
I can run this scan and then use the CandleGlance technique described in my article "Visual System Development" to verify that the results returned by the scan are correct. Right now (Saturday, April 17th), the scan is returning 63 stocks including DELL (of course), YUM, and even QQQ!
SCANNING FOR CHANNEL BREAKOUTS AND BREAKDOWNS
It's a simple matter to enhance the scan above so that it finds stocks that have just broken out of a channel. Simply add a 1 period offset to the "Max. High" and "Min. Low" criteria lines and then check to see if "today's" close is above/below the limits of the channel. For example, here's a scan that finds all of the stocks that have just moved above the top of the 30-40 channel we've been using:
Right now, only one stock meets that criteria - SSI. Is SpectraSite breaking out? There are several positive developments on its chart:
As always, successful scanning requires you to carefully review these examples, experiment with them until you are comfortable with how they work and then carefully incorporate them into your analysis work. Since scans can be used (and mis-used) in so many different ways, YOU need to invest time and effort in learning all about them first but I guarantee you that it is time and effort well spent. Hopefully, this article (and the previous ones I linked to) will help you get off on the right foot.


Posted by Chip Anderson at 4:00 PM in Chip Anderson | Permalink


April 03, 2004$XAU LAGGING GOLD BULLION By Chip Anderson
Arthur Hill
The Philadelphia Gold Index, $XAU, is usually a better predictor of gold than gold is of $XAU. The top chart shows $XAU relative to gold or the "price relative". Notice that XAU performs best when the price relative rises ($XAU outperforming gold) and the price relative can be used to confirm or not-confirm strength in $XAU.
$XAU advanced from 73.41 to 112.75 (mid July to early Dec) and outperformed gold over this period. While $XAU went to a new reaction high at 113.41, the price relative formed a lower high for a bearish divergence (red arrow). This was a clear sign that $XAU was underperforming gold and led to the double top.
More recently, gold moved to a new high and $XAU failed to follow suit. $XAU managed to find support at 95 and break above 105, but the index remains well below its January high. $XAU is underperforming gold and this should be a concern to gold/XAU bulls.


Posted by Chip Anderson at 5:05 PM in Arthur Hill | Permalink


April 03, 2004NEW DECISION POINT INDICATOR: PMM By Chip Anderson
Carl Swenlin
Does the world really need another indicator? Well, this is one we have been collecting data on for years, but we just recently started charting it because we discovered it presents a good picture of internal market strength or weakness.
Our Price Momentum Model (PMM) is a simple but effective mechanical model that we apply to all the stocks, indexes, and mutual funds we track. The PMM is always on a buy or sell, and it generates new signals when: (1) price moves 10% in the opposite direction of the signal extreme and (2) crosses the 200-EMA. For example, if the model is on a buy signal, a sell signal will be generated when the price index drops 10% from the highest price recorded during the buy signal and crosses down through the 200-EMA. (See http://www.decisionpoint.com/Glossary/PriceMomentumModel.html to learn more about the model.)
Since we track every stock in the Dow, Nasdaq 100, and S&P 500, we can calculate the percentage of the stocks on PMM buy signals. The resulting indicator is similar to the Bullish Percentage Index, which uses point and figure buy signals, but our PMM indicator tends to be a bit less volatile because a PMM signal change is harder to generate.
Currently, the indicator for the Nasdaq 100 (NDX) shows that considerable damage was done to the stocks in the index during the correction, as our indicator dropped below 50%; however, it is bouncing back nicely.
When the Percent PMM Buy index is above its 32-EMA, we generally consider the market environment to be positive because it shows a persistence in stocks being able to generate PMM buy signals. When it is below the 32-EMA, more caution is warranted, although it is possible for a market index to advance with only half its components participating (on PMM buy signals) because most indexes are capitalization weighted.
I think this indicator is most useful in evaluating the validity of major bottoms. If it can't move above its 32-EMA, it says the rally is not broad and is being led by a few large-cap stocks. Note how participation rose to over 90% within the first months of the 2003 bull market advance. This was also the case with the S&P 500, Dow, and the 112 Dow Jones US Sectors (which moved to 99%!).


Posted by Chip Anderson at 5:04 PM in Carl Swenlin | Permalink


April 03, 2004LOOKING AT THE RUSSELL 300 "GROWTH VS. VALUE" RATIO By Chip Anderson
Richard Rhodes
In terms of gauging the current substantial rally, we should look at the relative performance of the "growth" and "value" components thereof. In effect, if we are bullish, then we want to be long that which is outperforming. This is fairly simple.
Thus, when we look at the Russell 300 "Growth vs. Value" Ratio - we find the longer-term pattern is a confirmed "bearish wedge" continuation pattern, which augurs for lower lows than that seen during June/July 2002. However, a good short-term level in which to become sellers or buyers happens to be the 60-day moving average. In fact, Friday's sharp rally in the growth stocks has taken prices right back to this now important resistance level. If prices break above it - then one obviously wants to be long growth stocks over the next several weeks. But, if resistance proves its merit...then growth stocks will lag, and one could reasonably become short selected growth shares. In any event - any growth rally will be short-lived given the bearish wedge interpretation...which should translate into lower equity prices overall.


Posted by Chip Anderson at 5:03 PM in Richard Rhodes | Permalink


April 03, 2004CALENDAR CONTROLLERS By Chip Anderson
Site News
CALENDAR CONTROLLERS ADDED TO SC3 BETA - We aren't rolling out lots of new features this week like we have in weeks past, however we did manage to add two very neat icons to the "User-Defined" Duration section of the SharpCharts2 Beta page. Clicking on either of the little calendar icons will display a pop-up calendar control that you can use to quickly set the starting or ending date for your chart. The control compliments our existing dropdown boxes and you can use whichever you prefer. Check it out and let us know what you think!


Posted by Chip Anderson at 5:02 PM in Site News | Permalink


April 03, 2004RISING RATES HURTS BANKS AND HOMEBUILDERS By Chip Anderson
John Murphy
10-YEAR YIELDS SOAR OVER 4%... While today's surprisingly strong jobs report was good for stocks, it was very bad for bonds. Bond prices fell more than two full points. The 10-year T-note, which rises when prices fall, surged all the way to 4.14%. That certainly seems to confirm the idea that long-term rates are finally starting to move higher. There's good and bad news in that. It's good for economically-sensitive stocks that do well in a stronger economy. It's bad for rate-sensitive stocks that are hurt by rising rates. In time, rising rates can be a bad thing. Over the short-run, however, rising rates are viewed as confirmation that the economy is getting stronger and the job picture is finally improving. This week's sector rotations showed a more optimistic market. The top sectors were technology, materials, and industrials. The weakest were financials, energy, utilities, and consumer staples. That rotation is reversing the more cautious mood of the market during the first quarter when consumer staples and energy were the leaders and technology was the laggard.


Posted by Chip Anderson at 5:01 PM in John Murphy | Permalink


« Previous | Next »
金币:
奖励:
热心:
注册时间:
2006-7-3

回复 使用道具 举报

 楼主| 发表于 2009-4-2 17:41 | 显示全部楼层
March 20, 2004The AD Volume Lines By Chip Anderson
Arthur Hill
Breadth stats reflect continued preference to be overweight small and mid-caps, while underweight techs and large-caps. As the AD Volume Lines show, the S&P Midcap Index and S&P SmallCap Index remain the strongest. Both indicators for MID and SML remain above their 89-day EMAs, although the AD Volume Line for MID is currently testing the 89-day EMA (black arrow). The AD Volume Line for the Nasdaq 100 declined below its 89-day EMA in early March and remains weak (red arrow). The AD Volume Line for SPX is finding some support near the 89-day EMA and has yet to make a clean break (blue arrow).


Posted by Chip Anderson at 5:05 PM in Arthur Hill | Permalink


March 20, 2004DETERMINING THE TREND AND CONDITION OF THE MARKET By Chip Anderson
Carl Swenlin
The trend and condition of the market should dictate the kind of actions we will take, so these are the first things we should evaluate during the process of making investment/trading decisions. This process is necessary for all time frames, but for this article I will focus on the longer-term.
TREND: On a weekly-based chart we can evaluate the longer-term trend of the market using trend lines and moving averages. We can see that the long-term trend line drawn from the 2000 price top has been violated to the up side, and a new up trend is in the making. For a more objective definition of the trend I use the 17-week (fast) and 43-week (slow) exponential moving averages (EMAs). When the fast EMA crosses the slow EMA, it generates a buy or sell signal depending on the direction of the crossover. Currently, the 17-EMA is above the 43-EMA, so a buy signal is in effect and the trend is officially up. The 10-year period on the chart shows how effective the 17/43-EMA relationship is for catching long-term trends.
CONDITION: Next we want to determine the condition of the market within the trend. Specifically, is it overbought or oversold? Again we can use the relationship of the 17/43-EMAs, only this time we look to see how far they are apart. Comparing other periods where corrective action has taken place, we can see that the 17-EMA is well above the 43-EMA and showing the market to be very overbought. Also, the weekly PMO (Price Momentum Oscillator) has had a very long run from its October 2002 low, and it too is very overbought.
Finally, we can see that the market is already reacting to the overbought condition. The rising trend line from the March 2003 price low has been violated, and the PMO has topped and generated a crossover sell signal. These events imply that the current correction will continue for several more weeks; however, in the context of a long-term rising trend it is not likely that we have seen the final top for the bull market, but, of course, that remains to be seen.
ACTIONS: In a rising trend we look for opportunities to buy, but during a correction it is not likely that we will find very many. In fact, with the correction in progress, the more immediate priority will be to appropriately adjust stops on long positions and raise some cash for the time when the correction is finally over and new buying opportunities begin to pop up all over the place.


Posted by Chip Anderson at 5:04 PM in Carl Swenlin | Permalink


March 20, 2004NOT YOUR "GARDEN VARIETY" CORRECTION By Chip Anderson
Richard Rhodes
The past two-month trading period is one at the present time considered a "correction"; however, there are nascent signs it may be something quite a bit larger than just your "garden variety" correction. First, we note that trendline resistance is proving its merit by turning prices lower, which up to this point during March has allowed prices to form an "outside reversal month" lower. Now, whether this collective pattern remains in force and the monthly close near its low will be determined next...but it is negative nonetheless at this point.

Secondly, and a bit more of a "conundrum" if you will - is the current price level relative to the location of the both the 40-month and 50-month moving averages...it is in between.

What to do? Our strategy will be simple - we will respect the correction to 1060; but at that point make a determination as to the strength of the rally off that low. If strong - we become aggressive buyers until otherwise noted; if weak...then we aggressive sellers upon its completion. Outside of this - the ancillary technical evidence suggests the probability of the latter is greater...but we must remain objective.


Posted by Chip Anderson at 5:03 PM in Richard Rhodes | Permalink


March 20, 2004WHAT'S NEW IN BETA 3 By Chip Anderson
Site News
SHARPCHARTS2 BETA 3 - The improvements just keep coming! This week, we've added the Money Flow Index (see Chip's article above), Equivolume charting, support for annotations, the ability to email charts to others, the ability tostore charts in your browser's "bookmark" area, and a special color scheme for people with color deficient vision. Click here to get started and, as always, let us know how we're doing!
P&F CHARTS GAIN MORE SHARPCHARTS FEATURES - One of the "hidden gems" of our SharpCharts charting engine has been the "Price-by-volume" overlay that lets you see significant support/resistance levels easily. Now P&F Charts have that same feature! Check it out:


Posted by Chip Anderson at 5:02 PM in Site News | Permalink


March 20, 2004NASDAQ 100 LEADS MARKET LOWER. By Chip Anderson
John Murphy
NASDAQ 100 LEADS MARKET LOWER... The Nasdaq 100 QQQs were the worst percentage losers on Friday and reflected continuing weakness in the largest technology stocks. The daily chart shows the QQQ ending the week on a down note. The only saving grace was the relatively light volume. With the SOX leading the way down today, it looks like the QQQ will probably test its December low and its 200-day average just above 34. The final chart shows the hourly bars for the past week. Of particular notice was the last hour's volume bar. In the last hour of trading on Friday, the QQQ fell to a three-day low on the heaviest volume for the week. That shows some fairly heavy selling near the close on Friday.


Posted by Chip Anderson at 5:01 PM in John Murphy | Permalink


March 20, 2004Hello Fellow ChartWatchers! By Chip Anderson
Chip Anderson
The current market pull-back is getting serious. Check out the current Nasdaq chart:
See the long "Price-by-Volume" bar sticking out from the left side of the chart around the 1900 level? That represents the largest support level for the Nasdaq during the course of the past 12 months. If prices were to move below 1875, there's not much near-term historical support left. Staying above 1900 is very important for the index right now.
Our other newsletter contributors have more on the current state of the market below, but first I want to look at the newest indicator we've added to our site - the Money Flow Index.
THE MONEY FLOW INDEX
Since the site first got started, we've provided everyone with one of my favorite indicators, the Chaikin Money Flow (CMF). A variation of the Accumulation/Distribution line, the CMF combines price and volume movements into a single indicator that can be used to verify signals generated by other "price-only" indicators like the RSI and the MACD.
While the CMF continues to serve us well, we've just added its close cousin, the Money Flow Index in the new Beta release of our SharpCharts2 charting engine. The Money Flow Index (MFI) is a bounded oscillator that ranges between zero and 100 with an "overbought" level at 80, an "oversold" level at 20, and a center line at 50. Whereas the CMF uses the position of the close relative to the mid-point of each day's bar, the MFI uses the average of each day's high, low, and closing price to determine if money is "flowing" into or out of the stock.
In many ways, the MFI is less sophisticated than the CMF and that simplicity can result in premature signals. Consider the following chart:
Notice that the MFI topped out on 22-Dec (blue vertical line) whereas the CMF waited until the first week of January before turning lower for good (black vertical line). Of course, this suggests an extremely valuable use for the MFI - as a confirmation indicator for the CMF. Savvy chartwatchers would have noticed the developing divergence between the MFI and the CMF during the final weeks of 2003 and would have become more cautious about their MSFT positions.
As with all of our charting tools, I urge you to start using and experimenting with the MFI and see if it can help your investing track record. Remember that, for now, only our Beta edition of SharpCharts2 has the MFI (and TRIX) indicators. To get started, click here.


Posted by Chip Anderson at 5:00 PM in Chip Anderson | Permalink


March 06, 2004SECTORS AND EXPANSION By Chip Anderson
Arthur Hill
Relative strength or price relative charts provide an idea of which sectors will lead and lag over the next few weeks and months. These are formed by dividing the Sector Index by the Wilshire 5000 or another broad market index. These particular four sectors are positioned according to the place in an economic expansion in which they perform best. Techs and Transports are supposed to perform best during the early expansion phase, while Basic Materials and Energy perform best in the late expansion phase.
Sector performance suggests that we are in the late phase of an economic expansion. Techs are starting to weaken as the price relative broke below its trendline and Transports have totally fallen apart. The two standout performers are Energy and Basic Materials. Relative to the Wilshire 5000, the Energy SPDR (XLE) broke above resistance in December and continues to  forge new highs. The price relative for the Basic Materials SPDR (XLB) fell earlier this year, but bounced in February and remains in an uptrend.


Posted by Chip Anderson at 5:05 PM in Arthur Hill | Permalink


March 06, 2004LONG-TERM SELL SIGNAL FOR GOLD? By Chip Anderson
Carl Swenlin
When the monthly PMO (Price Momentum Oscillator) reaches a range extreme and changes direction, it is a pretty good indication that the long-term trend is changing. PMO direction changes in the middle of the range can often just be "noise", but, when the PMO has a long, sustained move in one direction and changes direction at an extreme overbought or oversold level, it demands our attention.
Such is the case now. The monthly PMO has been moving up for nearly three years, and it turned down this week. The PMO direction change is not official until the end of March , and, if gold rebounds from this correction, the PMO could still be rising as of the close on March 31. However, the situation is critical. Price has failed to hold above the long-term resistance around 415, but it remains above the the most accelerated rising trend line. If that support fails, chances are that gold will enter a correction lasting at least several months.


Posted by Chip Anderson at 5:04 PM in Carl Swenlin | Permalink


March 06, 2004THE "CONSUMER" SECTOR RATIO By Chip Anderson
Richard Rhodes
The stock market environment over the past six weeks has been fraught with a good deal of rotation out of specific indices such as the Dow and Nasdaq and into the S&P 400 midcaps and S&P 600 small caps. And it is precisely this rotation effect that we believe is developing in the weeks and months ahead between the Consumer Discretionary shares (XLY) and Consumer Staples shares (XLP).
In essence, the relationship between these two is a "signal" into investor confidence regarding spending patterns - a high ratio such as at 1.40 or above current levels mind you - indicates a belief stronger spending patterns are going to continue. However, we believe that given debt the incremental stimulus amount is likely to fall in the future means a "reversion" towards the mean will develop. Our target for this is the longer-term 200-week moving average which implies the recent decline off the highs is part and parcel of the first leg lower. Hence, we would be buyers of consumer staples and sellers of consumer discretionary and in some cases becoming outright short of discretionary shares - in particular several retailers.


Posted by Chip Anderson at 5:03 PM in Richard Rhodes | Permalink


March 06, 2004SC2 BETA 2 NOW READY! By Chip Anderson
Site News
SHARPCHARTS BETA 2 NOW AVAILABLE! - We're continuing the roll-out of our new charting engine - SharpCharts 2 - with the release of the second "Beta" version this week. Here's the scoop on what's new in Beta 2:
    CandleVolume Charts - The width of each candle is proportional to the corresponding volume for that day. Select "Candlevolume" from the "Style" dropdown. Moving Average Channels and Price Envelopes - Two new overlays that can help you spot oversold or overbought stocks. TRIX Indicator - We've added the TRIX to your arsenal. More Duration Choices - Quickly create 9 month and 5 years charts. Historic Intraday Charts - Intraday charts now end on whatever day you specify. User Defined Chart Widths - Specify exactly how wide you want your chart. Multiple Date Scales - You'll always see a date scale just below the price bars no matter how many indicator panels you add. Displaced Moving Averages - Add an optional second parameter to SMAs and EMAs that will displace them by that many periods. Here's an example:  

    Grid Density - Select exactly how much "gridness" you want on your chart. Additional Chart Styles - Area, Dot, Dashed Line and Histogram styles. Cumulative Charts - Plot AdvDec Lines accurately now.
  • Print Version - Click on the link to print just the chart.
(Note that some of these features are only available to members that are logged in to their accounts.)
To get started, visit this link: http://stockcharts.com/h/sc
As always, let us know what you think of our progress. There's still lots of work left for us to do - annotations, favorites, overlays and more. But we're getting there!
NEW SITE TOUR NOW ONLINE - We've revamped and updated our online site tour. Check it out to see all of the great things that StockCharts.com has to offer. Even veteran ChartWatchers may learn something...
P&F REVERAL MARKERS - There's a new option on our Graphical P&F Charts that shows you where the next reversal will take place. See the Charts #10 and #11 in the ChartWatchers Public List area for examples of the great new feature.
MORE SHARPCHARTS 2 SITINGS - Our new charting engine is now the charting force behind our free CandleGlance andGalleryView pages making those charts some of the best available on our website!


Posted by Chip Anderson at 5:02 PM in Site News | Permalink


March 06, 2004PLUNGING BOND YIELDS BOOST FINANCIAL SHARES By Chip Anderson
John Murphy
WEAK JOBS REPORT A MIXED BLESSING ... Today's weak job report was a shocker. It's weakness, however, is a mixed blessing. It's a potential negative for the economy since it erodes consumer confidence. At the same time, its negative economic message pushed bond yields sharply lower. Lower interest rates are good for the economy. That's probably why the stock market recovered today led by rate-sensitive stocks. But there's more. Lower interest rates keep the dollar weak. A weak dollar is bullish for commodity markets. That was seen in today's jump in most commodities. In the past, higher commodity prices have produced higher interest rates which helped stall commodity rallies. This time does seem to be different, which suggests that global deflationary pressures may still be at work. The bottom line is that the stock market doesn't have to worry about rising rates anytime soon. That should be a good thing. It should also be a good thing for commodity investments.


Posted by Chip Anderson at 5:01 PM in John Murphy | Permalink


March 06, 2004Hello Fellow ChartWatchers! By Chip Anderson
Chip Anderson
Last week saw all of the major averages post modest gains with the Russell 2000 (+2.3%) leading the way. The Nasdaq fell on Friday while the other averages rose and that behavior is consistent with a big change that happened last week on the Nasdaq's chart:
Prior to 23-Feb, the Nasdaq's 50-day Moving Average had provided support for the index on numerous occasions going back 12 months. On 23-Feb, the index moved below the average and then, last Tuesday (01-Mar), the index tried but failed to move back above that average. Friday's action provided more evidence that the 50-day moving average is now a resistance level for the Nasdaq for the first time in a year.
CANDLEVOLUME AND THE TRIX
CandleVolume charts are a new addition to StockCharts.com making their debut just this weekend (See the "Web Site News " section below for details). They are constructed just like regular candlestick charts with upper and lower "shadows" as well as filled and hollow "real bodies". Their distinctive characteristic is the width of each candlestick, which varies based on the volume for that particular time period. The higher the volume, the wider the real body of the candlestick. Here's an example chart ripped, as they say, straight from the headlines:
As you can see, the days where volume was extremely high really stand out on a CandleVolume chart!
One thing to be careful about however is to realize that the horizontal (time) axis is no longer linear - i.e. every time period is a different width. That can throw off traditional trendline and chart pattern analysis and, while we do plot indicators and overlays on these charts, they get "stretched and squeezed" also along the horizontal axis.
Another great tool that StockCharts.com is introducing this week is the TRIX indicator. The TRIX is a triply smoothed momentum indicator similar to the Rate-of-Change (ROC) indicator and the MACD. Like the ROC, it takes a single parameter which is the number of periods to use in the calculation. An optional second parameter is used to create a "signal line" MA that overlays the TRIX and can be used for cross-over signals.
The TRIX is an unbounded oscillator that moves above and below the zero line. By using three layers of exponential smoothing, the TRIX removes many "unimportant" price movements and help you focus on the longer-term trends. By the same token however, the TRIX can lag other indicators significantly. It is most useful for confirming signals generated by more "skittish" indicators like the ROC and RSI.


Posted by Chip Anderson at 5:00 PM in Chip Anderson | Permalink


« Previous
金币:
奖励:
热心:
注册时间:
2006-7-3

回复 使用道具 举报

 楼主| 发表于 2009-4-2 17:44 | 显示全部楼层
金币:
奖励:
热心:
注册时间:
2006-7-3

回复 使用道具 举报

 楼主| 发表于 2009-4-2 17:48 | 显示全部楼层
March 30, 2009Waiting for the Breadth Thurst ($RHNYA) By Chip Anderson
Market Indicators
Click here for a live version of this chart

The Record High Percent Index is a market breadth indicator created by dividing the number of 52-week highs for a given market by the sum of the number of new highs and the number of new lows.
Record High Percent = New Highs / (New Highs + New Lows)

The values range between 0.0 and 1.0. A value of 0.0 means that there were no new highs on that day. A value of 1.0 means that there were no new lows on that day. A value of 0.5 means that the number of new highs and new lows were equal.
StockCharts.com computes and publishes three versions of the Record High Percent Index - one for the NYSE ($RHNYA), one for the Nasdaq ($RHCOMPQ), and one for the American Stock Exchange ($RHXAX).
The Record High Percent Index is the basis for another popular index called the Breadth Thrust Indicator. First developed by Martin Zweig, the Breadth Thrust Indicator is equal to the 10-day simple moving average of the Record High Percent Index.
According to Zweig, a "Breadth Thrust" occurs when the Breadth Thrust indicator rises from below 40% to above 61.5% within 10 trading days. The signal occurs when the given market is in the process of changing from an oversold condition to one of strength, but has not yet become overbought. Zweig goes on to say that this signal typically occurs before most bull markets.
"Breadth Thrusts" are rare but significant.  When the market is really ready to rally again, expect to see the red line on this chart to jump.


Posted by Chip Anderson at 9:06 PM in Market Indicators | Permalink | Comments (1)


March 27, 2009Chaikin Money Flow Study ($SPX) By Chip Anderson
Market Indicators

Click here for a live version of this chart.

Often we get asked "What settings should I use on my indicators?  What's the best?" and our answer is the always infuriating "It depends."  The chart above shows why "It depends" is always going to be our answer.

I've added six different versions of the Chaikin Money Flow (CMF) indicator to this chart of the S&P 500.  Notice the different frequency with which the CMF lines cross the zero line and turn red.  The shorter the frequency, the more often (in general) the CMF turns red.

What's interesting on the chart above is all the whipsawing done by the 80-day CMF between July 08 and February 09 - and by tge 100-day CMF in March 09.  Very unusual.


Posted by Chip Anderson at 11:50 AM in Market Indicators | Permalink | Comments (0)


March 24, 2009Catapulting Bulls (PL) By Chip Anderson
P&F

Click here for a live version of this chart.

The "Bullish Catapult" P&F pattern is a great way to find stocks that are breaking out above resistance.  Today, Protective Life Corp. (PL) was the only high volume stock to create a new Bullish Catapult pattern when it moved above 6.0.  Right now, the catapult line is short but the P&F Price Objective is at PL's recent support line of 8.0.

(Click here for an explanation of P&F Price Objectives.)


Posted by Chip Anderson at 8:01 PM in P&F | Permalink | Comments (1)


March 20, 2009Bullish Percent Sector Indices Moving Higher By Chip Anderson
Market Indicators

Click here for a live version of this chart.


Click here for a live version of this chart.

Bullish Percent indexes show the percentage of stocks in a given group that have a "Buy Signal" on their P&F chart.  Above are charts with the 11 different sector-based Bullish Percent Indexes that we calculate here at StockCharts.com (with the S&P 500 BPI thrown in for good measure).

All of the BPIs started moving higher at the start of the month however some appear to be running out of steam right now.  Financial stocks are leading right now with Energy stocks close behind.  Smart investors always know where these Bullish Percent Indexes are going - they are some of the best market sentiment indexes available anywhere.


Posted by Chip Anderson at 4:26 PM in Market Indicators | Permalink | Comments (1)


March 19, 2009Singing in the (Ticker) Rain (FAS/FAZ) By Chip Anderson
other

Click here to start watching Ticker Rain

This is not your typical stock chart.  This is what you see after running our Ticker Rain program for a while.  It can show you what tickers are popular on StockCharts.com.  More importantly, it can show you what everyone else is looking at.  Each column represents a bunch of chart requests for a particular symbol.  The columns "grow" over time with the more popular symbols growing faster.

For instance, are you aware of the FAS/FAZ frenzy that's going on these days?  FAS (#3) and FAZ (#1) are relatively new "3x" ETFs that lots of traders are using to try and trade the market.

Of course SPY (#2) is always popular, but what about some of those other spikes?  Fire up Ticker Rain for yourself and mouse over the columns to see what people are charting.  I'm sure you'll get a couple of good ideas almost immediately.


Posted by Chip Anderson at 1:59 PM in other | Permalink | Comments (0)


March 18, 2009Bouncing Off Bollinger Bands (MTXX) By Chip Anderson
Momentum

Click here for a live version of this chart

How are your money management skills these days?  Here's a real test for you:

Over the past 10 months, MTXX has been bouncing up and down between roughly 14 and 19.  One of the first signals that the stock is about to start moving higher again has been when it penetrates its lower Bollinger Band (blue arrows).  While extremely risky by themselves, those signals have often been confirmed by MACD Histogram crossovers within a couple of days (red arrows).

By practicing good money management skills (tight stops, well defined exits, etc.), agile traders may be able to take advantage of MTXX's recent history now that it has gone and done it again (green arrow).  The rest of us can watch with interest to see if history will repeat.


Posted by Chip Anderson at 3:32 PM in Momentum | Permalink | Comments (3)


March 14, 2009Berkshire's "Flight to Safety" Breakouts (BRK/B) By Chip Anderson
Historical

Click here for a live version of this chart.

Continuing to look for "leading" technical signals that pointed to the market's recent crash.  It's always interesting to see how the country's "best" investor did.  Warren Buffet's Berkshire Hathaway had a couple of interesting jumps in its stock price during the period in question.  Comparing the percentage performance of BRK/B to $SPX, we can see two big jumps in 2007 (chart above) and one jump in 2008 (chart below).  Of course, not all jumps in BRK/B are signs of an impending crash - but these charts show that they shouldn't be ignored either.

Click here for a live version of this chart.


Posted by Chip Anderson at 11:24 AM in Historical | Permalink | Comments (0)


March 12, 2009Gold at 700 was the Beginning of the End By Chip Anderson
Historical
Click here for a live version of this chart.

The S&P 500 Index (yellow line) hit its most recent high in early October of 2007 (red arrow).  Since then it's been all downhill.  Were there any clear warning signs before the plunge began?

It's interesting to compare $SPX to $GOLD (the red line).  After creeping upwards consistently (on a log scale chart) since early 2001, gold spiked up to 715 in mid-2006 but quickly retreated back to its normal uptrend line.  However, gold's rate-of-increase increased as soon as it crossed 700 the second time in late August (blue vertical line).  $SPX began its fall soon afterwards.

Last November $GOLD retreated back to 705 before rallying again in the face to more bad economic news.  This suggests that the 700 level is important for both stocks and gold.  $GOLD probably needs to move below 700 in order to $SPX to begin a sustained recovery.


Posted by Chip Anderson at 8:55 PM in Historical | Permalink | Comments (7)


March 11, 2009S&P Bullish Percent Chart Turning Upwards ($BPSPX) By Chip Anderson
P&F

Click here to see a live version of this chart.

Bullish Percent charts track the percentage of stocks in a specified group that have a P&F "Buy Signal" on their charts.  While the large-scale Bullish Percent indexes - the NYSE's ($BPNYA) and the Nasdaq's ($BPCOMPQ) - are still in a downward column of O's, the S&P 500's ($BPSPX) reversed today(!) and is heading higher.  Will the others follow the S&P 500's lead?


Posted by Chip Anderson at 9:35 PM in P&F | Permalink | Comments (0)


March 09, 2009Large Caps, Mid Caps or Small Caps? By Chip Anderson
Performance
  
Click here for a live version of this chart.

Long term answer: Mid caps.  Next question?


Posted by Chip Anderson at 4:17 PM in Performance | Permalink | Comments (2)


Next »
金币:
奖励:
热心:
注册时间:
2006-7-3

回复 使用道具 举报

 楼主| 发表于 2009-4-2 17:49 | 显示全部楼层
March 07, 2009One of These Charts is Not Like the Others (Dow Stocks) By Chip Anderson
Moving Averages

Click here for a live version of these charts.

OK - I apologize for the size of the image above, but it's worth the extra time needed to download I promise!

These are 6-month candlestick charts of the 30 stocks that make up the Dow Jones Industrial Average.  As the old "Sesame Street" song goes, one of these things is not like the others.  Can you spot it?

All of these charts look... well... terrible.  But if you look closely, you'll see that one has its moving average lines reversed(!).  Instead of the red 50-day MA on top (a bearish signal), one of these stocks has the blue 20-day MA on top.  Can't spot it yet?  OK, one more hint - look at the direction of the red 50-day MA lines on all these charts - on every chart except one, the red line is headed down.

Relatively speaking, IBM has been doing much better than its Dow brothers over the past 4 months and it shows in the position of its 20-day and 50-day MAs.  (MRK was doing pretty good also until very recently.)  Doing group chart analysis like this can help you spot "outliers" like IBM that may deserve closer scrutiny.

(BTW, only one Dow stock has a rising 20-day MA right now and it's not IBM.  Can you spot it?)


Posted by Chip Anderson at 1:43 PM in Moving Averages | Permalink | Comments (2)


March 04, 2009The Only Nasdaq Stock in a New Uptrend Right Now (ACIW) By Chip Anderson

Click here for a live version of this chart.


Only one Nasdaq stock began a new uptrend today.  Well... began a new uptrend as defined by the ADX indicator.  ACI Worldwide Inc recently had a bullish 50/200 Moving average crossover (corresponding to a nice bump up on good volume) and now its ADX line has moved back above 20 for the first time this year.  The ADX line - the thick black one - indicates if a stock is "trading" (i.e., moving sideways in a range) or "trending" (moving up or down fairly consistantly).  The ADX line for ACIW is now indicating that the stock may be breaking out of its recent sideways ways and beginning to move higher.  It's one of the few stocks with these kind of positive technical signals right now.


Posted by Chip Anderson at 4:11 PM | Permalink | Comments (2)


March 03, 2009Vroom! Autozone Jumps the Gap (AZO) By Chip Anderson
Chart Pattern

Click here for a live version of this chart


After gapping down during December and January, AutoZone gapped up significantly in mid February and zoomed upwards today hitting a high of 157 at one point.  So why is the Chaikin Money Flow not zooming upwards as well?  The CMF gave a big "sell" signal today because the stock closed well below the mid-point of today's candle and thus the CMF considers most of today's huge volume spike to be "selling" volume.  Will this become another case of "all gaps must be filled?"


Posted by Chip Anderson at 8:02 PM in Chart Pattern | Permalink | Comments (2)


February 28, 2009What Did the VIX Know and When Did It Know It? By Chip Anderson
Market Indicators

Click here for a live version of this chart


The VIX is the Volatility Index published by the Chicago Board Options Exchange (CBOE).  It measures the "implied volatility" of a hypothetical SPX option created from a weighted average of several actual SPX options.  (For all the gory details, check out our ChartSchool article on the VIX.)  Typically, the VIX is interpreted as an "inverse" market indicator - i.e., down is bullish and up is bearish.  In the chart above, I've plotted the reciprocal of the VIX with the ratio symbol "$ONE:$VIX" (Note: $ONE is always equal to, you guessed it, one.)  That allows me to then compare it to a chart of the actual market.  Looking back at the past couple of years, you can see that the VIX did an uncanny job of indicating "trouble ahead" for stocks.  Just like when it started moving up before the market did in 2002, the VIX started moving down in 2007 and the market followed dramatically in 2008.  Definitely, don't ignore this chart!


Posted by Chip Anderson at 3:55 PM in Market Indicators | Permalink | Comments (3)


February 25, 2009The Battle for Apple (AAPL) By Chip Anderson
file:///Users/chipa/Desktop/ditc20090225.png
Click here for a live version of this chart.

Apple has been bouncing around $90 since October.  Is that support going to hold?  One way to gauge the strength of a support level is to use the "Vol by Price" overlay - the horizontal histogram on the left side of this chart.  It adds up all the volume for any days on the chart that close within the bars price range.  The bars in two colors - one for volume when the stock closed up and the other for when the stock closed down.  In the case of AAPL, the long horizontal bar shows that lots of volume has occurred in the $90 - $100 range and that is the most important support level on the chart right now.  It also shows that the volume on "up" days (gray) is almost equal to the volume on "down" days (light blue).  The Vol by Price overlay clearly shows that 90 is the battleground for AAPL right now.  With AAPL oscillating around $90 (possibly in a triangle pattern), the battle is getting very heated and is worth watching closely in the coming days.


Posted by Chip Anderson at 5:09 PM | Permalink | Comments (0)


February 23, 2009Up + Down = Down (CQP) By Chip Anderson
Momentum

Click here for a live version of this chart.
The MACD Histogram shows the change in momentum of the MACD Line.  The MACD Line - in turn - shows the change of momentum in the underlying stock.  In the case of CQP, the MACD Line has been moving up pretty steadily since early October (blue trendline).  Recently however the MACD Histogram has started moving lower and is now diverging significantly from the MACD Line.  This signals trouble for the stock - something that may already be appearing on the chart.


Posted by Chip Anderson at 4:50 PM in Momentum | Permalink | Comments (0)


February 19, 2009Support for the Dow? ($INDU) By Chip Anderson
Support / Resistance

Click here for a live version of this chart.

Today the Dow Jones Industrials closed below its 6 year low just under 7500.  What's the next important support level?  What's the one below that?  (and, gulp, the one below that?)  Here you go.  Let's hope those green lines on the right side of this chart stay green.


Posted by Chip Anderson at 4:52 PM in Support / Resistance | Permalink | Comments (1)


February 18, 2009Bottom Feeding: Time for Asia Time? (TYM) By Chip Anderson

Click here for a live version of this chart.

Trying to catch a "falling knife" like Asia Time (TYM) is extremely risky in any market.  Doing it in today's market is pure folly.  And yet...  TYM is the only stock on any of the major markets to have its RSI rise back above 30 after staying below 30 for several days.  Today's big rebound (on good volume) continued yesterday's bounce (on relatively light volume) and made the RSI movement possible.  Strong resistance at 0.50 appears to limit the upside however.  While extremely risky, this is still a technically interesting stock to watch over the next couple of days.


Posted by Chip Anderson at 6:57 PM | Permalink | Comments (1)


February 17, 2009Bollinger Band "Topo Map" ($INDU) By Chip Anderson
Moving Averages

Click here for a live version of this chart.
Based on the statistical concept of Standard Deviations, Bollinger Bands graphically illustrate how "far away" prices are from their "average" value.  Traditionally, 2.0 standard deviations are used to determine where the upper and lower bands should appear.  In the chart above, I've layered 6 different Bollinger Bands on top of each other going from 2.0 deviations to 3.0 deviations forming two "bands of Bands."  The "deeper" prices go into either band, the more likely things will "snap back" towards the dashed average line.  That's good news since the Dow plunged deep into the lower band today.


Posted by Chip Anderson at 6:45 PM in Moving Averages | Permalink | Comments (1)


February 13, 2009Long-Term Log Scale Chart Provides Context ($INDU) By Chip Anderson
Historical


How bad is it?  How big was the Internet bubble?  How does the current decline compare to the 1987 crash?  It's all here in black and white (and red and blue).  On a log scale chart like this, movements of the same percentage appear to have the same height regardless of the point values.
The key take away here is that when the Internet bubble burst in 2002, the market went back to the "normal" rate of climb that it established after the crash in 1987.  The current economic crisis destroyed that trendline in mid-2008 and is therefore much more serious.


Posted by Chip Anderson at 10:00 AM in Historical | Permalink | Comments (0)


« Previous | Next »
金币:
奖励:
热心:
注册时间:
2006-7-3

回复 使用道具 举报

 楼主| 发表于 2009-4-2 17:50 | 显示全部楼层
February 12, 2009After the Head and Shoulders (NDN) By Chip Anderson
Chart Pattern


NDN has been falling after completing a classic Head & Shoulders chart pattern back in January.   Today was the first set of positive technical signals for the stock in quite a while - a bullish MACD crossover, a rising RSI line and a bullish Parabolic SAR signal.  While all of these signals can be premature, when combined with three up days after what looks like an exhaustion sell off, the odds of a turnaround taking hold increase.

While I have no idea what will happen with this particular stock in the coming days, this is a good example of the kind of technical setup that all technical traders search for.  Each trader's setup will be different, but most will contain elements of technical indicator crossovers, support and resistance analysis, chart pattern identification and volume study.


Posted by Chip Anderson at 2:46 PM in Chart Pattern | Permalink | Comments (0)


February 10, 2009McClellan Summation Index Struggling to Stay Positive By Chip Anderson
Market Indicators

Click here for a live version of this chart.
The McClellan Summation Index is a great market indicator that recently set some all-time record lows back at the end of last year.  Since then, it has bounced back into positive territory, but over the past couple of days a new decline has begun.  While not unexpected, that is disappointing since "according to the McClellans, the beginning of a new bull market is signaled if the NYSE-based Summation index first moves below the -1200 level and then quickly rises above +2500."


Posted by Chip Anderson at 4:29 PM in Market Indicators | Permalink | Comments (0)


February 09, 2009Anatomy of a Doji (STAA) By Chip Anderson
Candlestick Patterns


STAA put in a huge Doji on its daily chart today.  Technically, a doji is a candlestick where the open and the close are the same.  The huge upper shadow and relatively small lower candle makes STAA's Doji especially striking.  It is very close to being a "Gravestone Doji" - a doji with a big upper shadow and no lower shadow.
Doji's often signal a reversal.  We can see the reason for that by looking at the 10-min intraday chart for STAA:


STAA gapped up on the open and then quickly rose to its high for the day (2.74).  It then spent the rest of the day slumping back to its opening price.   By 3:30, it had moved below the open to the low of the day - 2.00.  A late day buy order brought prices back up the opening level - 2.04.

As we can see on the intraday chart, the quick move up followed by a lack of follow thru had two consequences - 1.) it probably depressed the STAA bulls and 2.) it created the big doji on the daily chart.  Which is why dojis often indicate reversals.


Posted by Chip Anderson at 9:10 PM in Candlestick Patterns | Permalink | Comments (0)


February 06, 2009DROOY - Bullish CMF Signal Confirmed by Long-Term Crossover By Chip Anderson
Moving Averages

(Click here for a live version of this chart.)

Durban Roodeport Deep (DROOY) is a major gold mining company in South Africa.  Their stock jumped in late November generating a "buy" signal from the standard 20-day Chaiken Money Flow (CMF) in early December.  The longer term moving averages for DROOY crossed today providing a major technical "buy" signal for the stock.


Posted by Chip Anderson at 3:11 PM in Moving Averages | Permalink | Comments (0)


February 05, 2009Sirius XM Radio's (SIRI) Runaway Gap Up By Chip Anderson

(Click here for a live version of this chart.)

SIRI gapped up on the open and moved higher from there today on strong volume.  Very nice turnaround play with resistance at 0.225.  When a stock that is already in an uptrend gaps up like this, it is called a "Runaway Gap."


Posted by Chip Anderson at 4:49 PM | Permalink | Comments (1)


February 04, 2009Hitachi's (HIT) RSI Rebound By Chip Anderson
Momentum


(Click here for a live version of this chart.)


Hitachi's RSI indicator moved back above 30 today after sinking down around 20 two days ago.  This big jump indicates that an important rebound is underway and has a good chance of continuing at least until the RSI crosses 50 again.  The price action shows what may be a selling climax follow by a strong 2-day rally.  This is worth watching closely.


Posted by Chip Anderson at 5:05 PM in Momentum | Permalink | Comments (0)


February 03, 2009NetFlix (NFLX) has a Powerful MA Crossover By Chip Anderson
Moving Averages


The 50-day Simple Moving Average for NetFlix moved above the 200-day Simple Moving Average today in a very convincing manner confirming the stock's gains over the past couple of days.  No other heavily traded Nasdaq stock has a similarly bullish signal right now.


Posted by Chip Anderson at 10:28 PM in Moving Averages | Permalink | Comments (1)


February 02, 2009Quadruple Bottom P&F Breakdown for Target (TGT) By Chip Anderson
P&F

(Click here to see a live version of this chart.)


Target Corp's Point and Figure chart broke below the bottom of the Quadruple Bottom Pattern that it had put in over the past 5 weeks.  See the 4 "O's" in the boxes at 32?  Those "O's" formed the bottom of the pattern.  Today's decline to 30.20 filled in the 31 and 30 boxes, signaling the breakdown.


Posted by Chip Anderson at 8:26 PM in P&F | Permalink | Comments (0)


January 30, 2009Dark Cloud Cover for ODFL By Chip Anderson
Candlestick Patterns
(Click here to see a live version of this chart.)


The Dark Cloud Cover candlestick pattern occurs when a stock that is in an uptrend has a tall hollow candle that is followed by a tall filled candle that extends below the mid-point of the first candle.
A Dark Cloud Cover pattern signals short-term weakness for the stock.  The idea is that investors who were excited by Thursday's big rise are now disheartened by today's lack of follow through - thus making another rally unlikely in the near term.


Posted by Chip Anderson at 11:48 PM in Candlestick Patterns | Permalink | Comments (0)


January 29, 2009Nasdaq Bullish Percent Index will Signal the Return of the Bulls By Chip Anderson
Market Indicators

(Click on the chart for a live version)

The Nasdaq Bullish Percent Index represents the percentage of Nasdaq stocks that have Bullish signals on their P&F charts.  Typically, readings oscillate around 50.  Readings above 60 are rare and indicate a strong rally is underway.  Readings below 20 are also rare and usually indicate market weakness.
$BPCOMQ's strong move above 60 in early 2003 signaled the end of the last bear market.  Expect a similar move to herald the end of the current recession.


Posted by Chip Anderson at 10:42 PM in Market Indicators | Permalink | Comments (0)


« Previous
金币:
奖励:
热心:
注册时间:
2006-7-3

回复 使用道具 举报

 楼主| 发表于 2009-4-2 17:57 | 显示全部楼层

After Market Close Feb 20, 2009

LOA?


"Look out above?" Maybe, but that's not in the bag. We've got some Buy signals, despite the down close on the S&P and Dow, but they aren't confirmed. There were a lot of Bulls in some of the polls, but if this is for real, that's not enough to stop the rally. We need to get above some resistance on volume and good breadth.

DJIA: The Dow still looks a bit sick, but it's dominated by zombie and near zombie financials.
SPX: The S&P needs to get back above 800 or so to really be Bullish. Nice reversal, though.
NDX:  The Naz closed up. That's Bullish.
RUT: The illiquid Russell got butchered last week. I don't see much to be bullish about here.
HUI: The miners were up but they can't seem to break out.
DXY: The Buck is still in an up trend.
DJT: The Trannies are just looking horrible, but that's a very steep decline.
SOXX: The Semi's were up but not a lot. Still, that's impressive.
EGO: El Dorado was up nicely, again.
COGT: Cogent was up and we need to honor our stop on the remainder of the position.
OCR: Maybe we can get lucky on the Omnicare.
ORI: We got a very nice play out of the Old Republic. Nice profit and even better exit due to the 10% rule. I'd not want to be short this one any more.
ROP: Roper still looks very promising.
AMGN: Amgen is biding its time.
ALXN: Alexion looks vulnerable to a pullback, but we can't really play it. The PN stick adds a tad of risk too. Wait for the break if you do try it.
TSFG: Souther Financial Group absolutely fell apart since it was offered as a yo-yo short. The volatility was why we passed on it for the model portfolio and the poor behavior of the group was why we liked it as a short for those who could manage the risk.

Summary:

I'm still a Bull, but I've got very little technical support and confirmation, right now. We did put in a very nice reversal stick and the volume was promising, but the key will be more volume still as we break some resistance levels. Participation in all the sentiment polls is way up. Some show a ton of Bears, but others show a ton of Bulls. Be prepared for more volatility. Try to honor every Buy signal.

Be Well, and Trade Smarter Than the Average Bear!
-The ChartSmarts Team
金币:
奖励:
热心:
注册时间:
2006-7-3

回复 使用道具 举报

 楼主| 发表于 2009-4-2 17:59 | 显示全部楼层
[ Back to Carl Swenlin Interview Menu ]   [ Back to AegeanCapital Web Site ]

This interview with Carl Swenlin, president of DecisionPoint.com, was conducted by Ike Iossif president of AegeanCapital, Inc.
MarketViews.tv, Copyright © 2001-2008, All rights reserved. AegeanCapital Inc., is not affiliated with any of its guests, or the firms associated with them. The views expressed, are solely the views of the guests and of the firm they represent. AegeanCapital receives NO compensation of any kind from its guests, either for their appearance, or from any subscription fees that may result due to their appearance.
LISTEN
The following charts were discussed in the interview. ********************************
Timing Model Status


********************************
Stocks


********************************
US Dollar Index


********************************
Gold


********************************
Crude Oil


********************************
CCI Index


********************************
Bonds


********************************


[ Back to Carl Swenlin Interview Menu ]   [ Back to AegeanCapital Web Site ]

This interview with Carl Swenlin, president of DecisionPoint.com, was conducted by Ike Iossif president of AegeanCapital, Inc.
MarketViews.tv, Copyright © 2001-2009, All rights reserved. AegeanCapital Inc., is not affiliated with any of its guests, or the firms associated with them. The views expressed, are solely the views of the guests and of the firm they represent. AegeanCapital receives NO compensation of any kind from its guests, either for their appearance, or from any subscription fees that may result due to their appearance.
LISTEN

The following charts were discussed in the interview. ********************************
Timing Model Status


********************************
Stocks


********************************
US Dollar Index


********************************
Gold


********************************
Crude Oil


********************************
CCI Index


********************************
Bonds


********************************
FINAL 2008 TIMER DIGEST RANKINGS FOR DECISION POINT #4 Bond Timer (*TD Index: 112.32) #5 Gold Timer (TD Index: 126.33) #9 Long-Term Timer Stocks (TD Index: 132.35) *All timers are assigned an Index of 100 at the beginning of the year. The amount above or below the beginning index indicates the gain or loss for the year.
********************************
金币:
奖励:
热心:
注册时间:
2006-7-3

回复 使用道具 举报

 楼主| 发表于 2009-4-2 18:04 | 显示全部楼层
www.tdtrader.com
The Daily Swing - Arthur Hill
Friday, 27 March 2009 7:30AM ET ***Executive Summary***
  • Stock Market: Reserved…
  • AD Volume Net% Lags for the S&P 500
  • Financials Lag at Resistance
  • A Look at the 2002 Surge
  • QQQQ Extends into Resistance Zone
  • IWM Gaps Up and Holds Gap
  • UUP Shrugs off Global Currency Jabber
  • GLD Forms Rising Wedge
  • USO Extends within Rising Flag
  • IEF Corrects with Bullish Flag
***Technical Highlights*** ***Breadth Turns Mixed*** Stocks surged again on Thursday with a pretty broad advance. All nine sectors were higher with materials, industrials and consumer discretionary leading the way higher. These three were up over 4% each. Financials lagged with a relatively small gain (+1.18%). The table below shows the breadth stats for the major indices. Notice that breadth was very strong for the Nasdaq 100 ETF (QQQQ) and the Russell 2000 ETF (IWM). It is positive to see techs and small-caps leading the way higher. AD Net% was also very strong for the S&P 1500 ETF (ISI) and the S&P 500 ETF (SPY), but AD Volume Net% was not very impressive. Relative weakness here can be attributed to energy, consumer staples and financials. Even though yesterday's surge was impressive overall, the market was not firing on all cylinders and this could foreshadow a pullback. ***
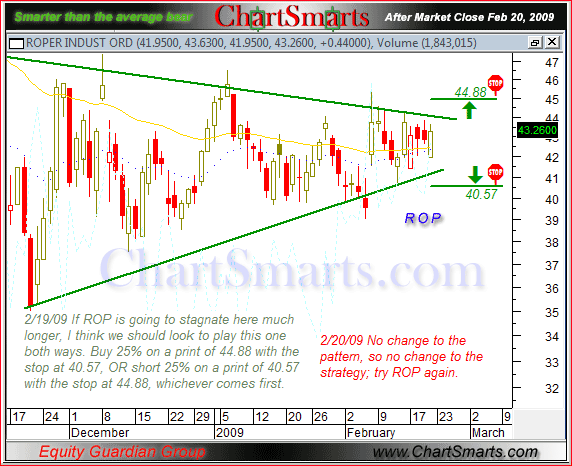
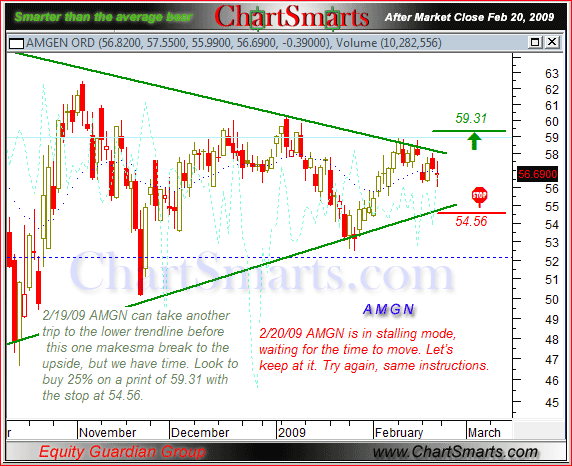
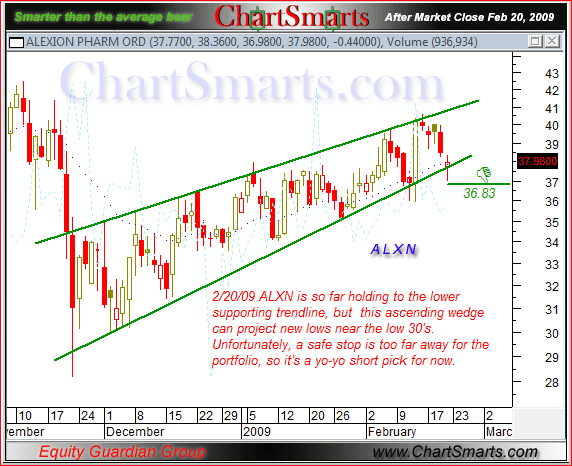
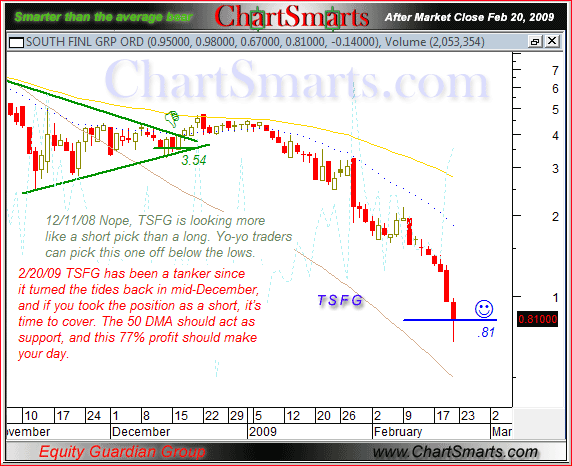
Financials Lag*** Once again, I will highlight three key financial ETFs as they stall at resistance. He who hesitates is lost. Well, the financial ETFs are hesitating near resistance. The Financials SPDR (XLF) stalled the six days with resistance just above 10. This stall started with a big dark cloud cover pattern last Thursday. The Regional Bank HOLDRS (RKH) surged above last week's high on Monday, but stalled with inside days on Tuesday, Wednesday and Thursday. The long white candlestick and three inside days form an extended harami. The Broker Dealer iShares (IAI) also surged above last week's high with a long white candlestick on Monday and then stalled the last three days. I still think the odds favor a correction or consolidation as all three remain overbought and at resistance. ***A Record Three Weeks*** According to my data, the current three week rally is the largest in over 40 years for the S&P 500. The next biggest surge was August 1982, when the index surged almost 13% in three weeks. This surge kicked off a bull market that lasted until the 1987 crash. The chart below shows the current surge relative to the 2002 surges. The S&P 500 bottomed in July 2002 and surged 22% in 4-5 weeks (green arrows). After this momentous surge, the index embarked on a 38 week trading range and tested the July low twice. Bottoming is a process, just like healing. As in July 2002, stocks became too oversold in early March 2009. The current rally alleviated these oversold conditions and the healing process has begun. The March low may hold for some time to come, but we are very likely to see a significant pullback that will allow a second chance to partake with lower risk. ***Major-index ETFs*** ***Medium-term Trend*** Despite another surge, there is not much change in the medium-term analysis. Over the last 13 days, SPY is up 22%, QQQQ is up 22% and IWM is up 29%. IWM also led the way higher during the Nov-Dec surge. The advance over the last three weeks is impressive – no doubt. However, IWM and SPY are still overbought and within resistance zones. The 62% retracement line (blue) cuts right through the middle of the last consolidation (late Jan- early Feb). QQQQ surged into its resistance zone from the January-February highs. I under estimated the strength of this rally, but I am still not going to chase the market when the major-index ETFs are overbought and at resistance. ***Short-term Trend*** The recovery started late Wednesday and continued on Thursday. QQQQ, SPY and IWM held Monday's gap and surged to new highs for the move. Technically, the short-term trend is up as the major-index ETFs forge higher highs and higher lows. Thursday's gap turns into the first support level to watch for signs of weakness. Even though I run the risk of being a stopped clock (correct twice a day), I will remain short-term bearish because of overbought conditions and resistance on the daily charts. The risk is that end-of-quarter window dressing further fuels the rally. However, I still think the odds favor a pull over the next 1-3 weeks. ***Inter-Market Charts*** ***Dollar*** The Dollar continued to shrug off the frivolous global currency debate and edged higher on Thursday. There is not much change in the technical picture. The US Dollar Bullish ETF (UUP) found support near the 62% retracement mark and moved higher the last five days. Even though the advance looks like a potentially bearish rising flag, the bulls have the short-term edge as long as it rises. Support remains at 25 and a break below this level would signal a continuation lower. As long as the flag rises, I expect a move towards broken support around 25.9-26. The Euro ETF (FXE) became overbought after the surge above 137 and met resistance at the 62% retracement mark. In contrast to the Dollar, FXE sports a potentially bullish falling flag with resistance at 136.6. A break above this level would be bullish. However, as long as the flag falls, the bears have the edge and I expect a move towards broken resistance around 129-130. ***Gold*** If the Dollar bounces back to broken support, then gold could come under pressure in the coming days. The Gold SPDR (GLD) surged last week, but never followed through on this big move off support. After this surge, GLD pulled back to the Oct-Nov trendline and firmed over the last three days. On this daily chart, a break below 90 would be most negative and I would then expect a decline into the low 80s. On the 30-minute chart, the bounce over the last three days looks like a rising wedge, which is potentially bearish. GLD broke the lower trendline yesterday and further weakness below 91.5 would argue for a continuation of the prior decline. This would be the early signal to expect a more important support break at 90. ***Oil*** There is still no change in the United States Oil Fund ETF (USO). The ETF remains in a short-term uptrend and medium-term downtrend. The advance over the last few weeks looks like a rising flag, which is potentially bearish. USO became short-term overbought as RSI(2) moved above 90 on Monday. In addition, USO is trading near resistance from the upper trendline of the rising flag. Looks like time for a pullback. On the 30-minute chart, USO has been edging higher the last four days. First support is set at 31 for top pickers. ***Treasuries*** The Treasury market is perking up. The 20+ Year T-Bond ETF (TLT) opened weak and closed strong for the second day running. Overall, the ETF remains within a trading range. However, TLT is trying to firm above last week's low and continue last week's surge. A move above this week's high would show some promise. I am also showing the 7-10 Year T-Note ETF (IEF), which actually looks bullish. Notice that IEF broke resistance with a big surge last week and the decline over the last six days looks like a falling flag. A break above flag resistance would signal a continuation higher. Of note, the Fed is continuing with its plan to purchase $300 billion of Treasuries. On Wednesday, the Fed purchased $7.5 billion worth of Treasuries. Buying resumes today. This gives new meaning to the term: don't fight the Fed. The Fed wants interest rates lower and Treasury prices higher. Moreover, it now has skin in the game. While there are long-term supply concerns, purchases from Fed mean Treasuries are likely to hold support levels. Good day and good trading -Arthur Hill Click Here for a Free Trial Good day and good trading -Arthur Hill ---------------------------------------------
Click Here for a Free Trial -------------------------------------
About: The Daily Swing is posted every trading day around 7AM ET and focuses on trading strategies for QQQQ, SPY and IWM. A video accompanies the written commentary with further insights into gold, oil, bonds and the Dollar. Videos featuring stock setups are published on Tuesdays and Thursdays.
------------------------------------------
Disclaimer: Arthur Hill is not a registered investment advisor. The analysis presented is not a solicitation to buy, avoid, sell or sell short any security. Anyone using this analysis does so at his or her own risk. Arthur Hill and TD Trader assume no liability for the use of this analysis. There is no guarantee that the facts are accurate or that the analysis presented will be correct. Past performance does not guarantee future performance. Arthur Hill may have positions in the securities analyzed and these may have been taken before or after the analysis was present.
-------------------------------------------

金币:
奖励:
热心:
注册时间:
2006-7-3

回复 使用道具 举报

 楼主| 发表于 2009-4-3 06:52 | 显示全部楼层
April 1, 2009

www.ord-oracle.com
For 30 to 90 days horizons: Long SPX on 1/21/09 at 840.24. Sold 2/6/09 at 868.60 gain 3.4%.
Monitoring purposes XAU: LONG XAU on 12/18/07 at 162.05.
Long Term Trend monitor purposes: Flat
We have "800" phone update that cost $2.00 a min. and billed to a credit card. Call (1-970-224-3981) for sign up. We update Eastern time at 9:45 and 3:15. Question? Call me (402) 486-0362.

Today’s rally came on higher volume then yesterday and the gap day of 3/30 and suggest the short term rally should continue to the next resistance area which is the gap level at 83 formed between 3/26 and 27. If the 83 gap area is tested on lighter volume then we could end up with a sell signal. Today’s Tick index closed at +1442 and at extreme level and shows exhaustion to the upside and implies the rally may not last to much longer. Still flat for now.
We still own ASTM a biotech stem cell reach company (but does not do stem cell research on embryo’s). Long POWR at 13.70 on 12/14/07.

This graph shows what the intermediate term trend is about to do. The bottom window is the McClellan Summation index and the Bullish Percent index (BPI). These to indicators are unrelated but usually follow the trend of the market nicely. BPI has already turned down and warns that a top is not far off. The McClellan Summation index is starting to bend over but has not turned down yet. The second window from the bottom is the MACD which is also a trend following indicator. It to is bending over but has not turned down yet. The third window up form bottom is the daily RSI. Bear market rallies usually end near the 60 range and that level was reached last week. Either volume picks up now and pushes the market to new recent highs or a top will for most likely from near the 83 range on the SPY.

It still appears to us that a potential “Three Drives to Top” is forming and the market is working on the third top now. Volume has decreased significantly over the last week both on the decline and rally and suggest the market is just hanging here. For a rally to continue, volume should increase and that is not what is happening here. The decline into the March 10 low retraced over 62% of the previous rally and gives credence that this is a “Three Drives to Top” pattern. Also the On Balance Volume hit extremes and is a short term negative along with the Accumation/Distrubtion indicator. Either market volume picks up here to push through the highs or market will have formed a “Three Drives to Top” pattern that has a downside target near 27 on GDX.
Sold PMU on 2/29/08 at 1.20, bought at .81 for gain of 48%. Long KRY at 1.82 on 2/5/08. We are long PLM at 2.77 on 1/22/08. Holding CDE (average long at 2.77 (doubled our position on 9/12/08 at 1.46). Bought NXG at 3.26 on 6/4/07. We doubled our positions in KGC on (7/30/04) at 5.26 and we now have an average price at 6.07. Long NXG average of 2.26. For examples in how "Ord-Volume" works, visit www.ord-oracle.com.


StockWatchApr 02 6:50 PM EDT

Name SymbolLastTickChg% ChgOpenHighLowVolume
B2B Internet Holdrs  BHH0.2601 -0.0099-3.67%0.290.29990.257220.4 k
Biotech Holdrs  BBH88.16 -1.23-1.38%90.7590.7587.70282.8 k
Bldrs Index Funds Trust Bldrs Asia 50 Adr Index Fund  ADRA19.62 0.955.09%19.3519.9819.3213.06 k
Bldrs Index Funds Trust Bldrs Developed Markets 100 Adr Index Fund  ADRD15.58 0.654.35%15.3115.8215.1129.84 k
Bldrs Index Funds Trust Bldrs Emerging Markets 50 Adr Index Fund  ADRE29.81 1.394.89%29.2730.0829.27195.72 k
Bldrs Index Funds Trust Bldrs Europe 100 Adr Index Fund  ADRU15.207 0.87696.12%15.099915.29315.09997.86 k
Broadband Holdrs  BDH10.14 0.383.89%9.9210.299.85875.44 k
Select Sector SpdrConsumer Discretionary  XLY21.11 1.105.50%20.4021.4020.3011.0 m
Select Sector SpdrConsumer Staples  XLP21.91 0.452.10%21.7122.129921.667.86 m
Db Commodity Index Tracking Fu  DBC20.72 0.773.86%20.6920.9320.564.61 m
Proshares Trust  SRS46.297 -7.479-13.91%50.3851.5844.6436.73 m
Diamonds  DIA79.71 2.182.81%79.3880.7678.9830.18 m
Select Sector SpdrEnergy  XLE45.14 1.784.11%44.9845.8944.8135.31 m
Euro Currency Trust  FXE134.40 2.051.55%134.31135.17134.10421.68 k
Europe 2001 Holdrs  EKH40.78 0.000.00%N/AN/AN/A0
Fidelity Nasdaq Composite Index Tracking  ONEQ62.7675 1.66552.73%63.4364.0062.2146.73 k
Select Sector SpdrFinancial  XLF9.31 0.252.76%9.599.629.18238.22 m
First Trust Dow Jones Select Microcap Index Fund  FDM12.8874 0.86737.22%12.4412.9112.3726.78 k
Select Sector SpdrHealth Care  XLV24.30 0.100.41%24.7024.7024.2110.71 m
Select Sector SpdrIndustrial  XLI19.85 1.015.36%19.2420.1219.2013.18 m
Internet Architecture Holdrs  IAH34.91 0.8422.47%34.8435.8534.8435.3 k
Internet Holdrs  HHH36.47 1.203.40%35.8836.8535.3685.1 k
Internet Infrastructure Holdrs  IIH2.08 0.073.48%2.052.202.046417.8 k
iShares Trust Cohen & Steers Realty Majors Index Fund  ICF29.79 2.438.88%28.0030.2128.002.72 m
iShares COMEX Gold Trust  IAU88.87 -2.22-2.44%88.8489.4088.00735.15 k
iShares Dow Jones Select Dividend Index ETF  DVY33.0101 0.99013.09%32.7733.4332.551.05 m
iShares Trust Shares DJ Transportaion Average Index Fund  IYT52.42 3.857.93%49.6753.6049.341.72 m
iShares DJ US Basic Materials Sector Index Fund  IYM38.18 1.754.80%37.9738.6837.572.28 m
iShares Trust DJ US Consumer Services Sector Index Fund  IYC41.81 1.744.34%40.8042.3840.80234.35 k
iShares Trust DJ US Consumer Goods Sector Index Fund  IYK42.69 0.992.37%42.4843.32742.36163.56 k
iShares Trust Energy Sector Index  IYE26.82 1.013.91%26.8627.3026.68513.72 k
iShares DJ US Financial Sector Index  IYF34.52 1.023.04%35.1035.1934.1611.95 m
iShares Trust DJ US Financial Services Index Fund  IYG36.29 0.912.57%37.2037.5935.762.68 m
iShares Trust- Shs Dow Jones US Healthcare Sector Index Fund  IYH49.57 0.240.49%50.1050.1349.42213.81 k
iShares DJ US Industrial Sector  IYJ37.32 2.035.75%36.0237.8636.02563.5 k
iShares Trust DJ US Real Estate Index Fund  IYR26.90 1.676.62%26.0227.3925.7250.19 m
iShares Trust- Shs Dow Jones US Technology Sector Index Fund  IYW39.06 1.213.20%38.6739.8938.57862.47 k
iShares DJ US Telecom  IYZ17.12 0.593.57%16.8817.3516.761.45 m
iShares Trust- DJ US Index Fund  IYY40.87 1.152.90%40.7841.5640.643373.57 k
ishares Trust- Shares Dow Jones US Utilites Sector Index Fund  IDU61.774 1.0541.74%61.8762.4560.89156.24 k
iShares FTSE/Xinhua China 25 Index Fund  FXI30.80 1.585.41%30.4931.4730.3951.68 m
iShares Trust- Shs S&P GSSI Natural Resources Index Fund- ETF  IGE25.02 0.823.39%24.8325.4524.83382.05 k
iShares Trust- Shs S&P GSTI Networking Index Fund  IGN18.56 0.965.45%17.9918.8417.9956.2 k
iShares Trust GS Semiconductor Index Fd  IGW32.97 1.294.07%32.3733.54532.27238.47 k
iShares Trust- Shs S&P GSTI Software Index Fund  IGV34.70 1.133.37%34.1735.3234.08381.13 k
iShares Trust- Shs S&P GSTI Technology Index Fund  IGM36.96 1.163.24%36.5337.6736.44386.21 k
ISHARES iBoxx USD InvestTop Investment Grade Corporate Bond Fund- ETF  LQD93.49 0.030.03%93.7493.9793.261.23 m
iShares KLD Select Social Index Fund  KLD35.94 0.862.45%35.808836.553835.80889.87 k
iShares Trust Lehman 1-3 yr Treasury Bond Fund- ETF  SHY84.02 -0.14-0.17%84.0784.1283.97996.68 k

StockWatchdelayed 20 minutes

Name SymbolLastTickChg% ChgOpenHighLowVolume
iShares Trust Lehman 20+ year Treasury Bond- ETF  TLT105.07 -1.30-1.22%105.89106.07104.841.77 m
iShares Trust Lehman 7-10 year Treasury Bond- ETF  IEF95.92 -0.63-0.65%96.2296.292495.70552.38 k
iShares Lehman US Aggregate Bond Fund ETF  AGG100.75 -0.323-0.32%101.11101.12100.54960.44 k
iShares Trust Lehman TIPS Bond Fund- ETF  TIP102.01 -0.63-0.61%102.53102.65101.791.06 m
iShares Tr Morningstar Large Core Index Fd  JKD48.0902 1.17032.49%48.0748.929947.9038.94 k
iShares Tr Morningstar Large Gwth Index Fund  JKE42.52 0.932.24%42.4543.2442.3284.45 k
iShares Tr Morningstar Large Value Index Fd  JKF43.04 0.691.63%43.5443.789943.0481.72 k
iShares Tr Morningstar Mid Core Index Fund  JKG47.18 1.944.29%46.6147.75746.4513.45 k
iShares Tr Morningstar Mid Growth Index Fd  JKH54.1624 2.37244.58%53.1854.7853.1316.91 k
iShares Tr Morningstar Mid Value Index Fd  JKI42.7545 1.40453.40%42.5743.4642.4618.95 k
iShares Tr Morningstar Small Core Index Fd  JKJ48.08 2.455.37%47.0448.779347.0454.17 k
iShares Tr Morningstar Small Gwth Index Fund  JKK46.74 1.914.26%46.1347.4545.9111.75 k
iShares Tr Morningstar Small Value Index Fd  JKL42.32 2.185.43%41.4842.899441.4527.19 k
iShares, Incorporated- Shares MSCI Australia Index Fund  EWA14.41 0.795.80%14.2114.5914.207.05 m
iShares, Incorporated- Shares MSCI Austria Index Fund  EWO13.06 0.473.73%13.0313.4912.79512.95 k
iShares, Incorporated- Shares MSCI Belgium Index Fund  EWK8.44 0.253.05%8.468.61888.4464.61 k
iShares, Incorporated- Shares MSCI Brazil Index Fund  EWZ41.83 2.596.60%41.3242.2941.1525.39 m
iShaes, Incorporated- Shares MSCI Canada Index Fund  EWC17.41 0.422.47%17.4817.7417.392.96 m
iShares MSCI Growth Index Fund  EFG40.80 1.443.66%40.6041.5240.42139.93 k
iShares Trust MSCI EAFE Index Fund  EFA40.31 1.744.51%39.9040.9639.8657.24 m
iShares Value Index Fund  EFV36.054 1.7945.24%35.6636.6335.54253.27 k
iShares MSCI Emerging Market Income ETF  EEM27.02 1.395.42%26.5927.4126.558106.96 m
iShares, Incorporated MSCI EMU Index Fund  EZU26.30 1.214.82%26.0026.7926.00146.31 k
iShares France Index Fund  EWQ18.38 0.895.09%18.2218.7018.17166.15 k
iShares Germany Index Fund-(MSCI)  EWG16.10 0.905.92%15.9316.3915.911.03 m
iShares Hong Kong Index  EWH10.96 0.585.59%10.8611.1710.8312.15 m
iShares Italy Index Fund  EWI13.46 0.614.75%13.2213.6413.21166.16 k
iShares Japan Index Fund  EWJ8.42 0.2933.61%8.348.528.3366.25 m
iShares, Incorporated- Shares MSCI Malaysia Index Fund  EWM7.52 0.283.87%7.397.567.39907.49 k
iShares Mexico Index Fund  EWW29.40 1.415.04%28.8729.7928.574.94 m
iShares Netherlands Index Fund  EWN13.21 0.483.77%13.1713.4513.14149.74 k
iShares MSCI Pacific Ex-Japan Index Fund- ETF  EPP26.51 1.264.99%26.2426.9926.121.75 m
iSshares Singapore Index Fund  EWS6.74 0.314.82%6.766.906.736.09 m
iShares MCSI South Africa Index Fund ETF  EZA39.70 1.022.64%39.5040.5639.4201358.8 k
iShares, Incorporated- Shares MSCI South Korea Index Fund  EWY31.73 2.006.73%31.4532.2531.005.25 m
iShares Spain Index Fund  EWP32.26 1.514.91%31.8732.8631.82189.61 k
iShares Sweden Index Fund  EWD15.71 0.835.58%15.5016.0615.41166.81 k
iShares Switzerland Index Fund  EWL15.89 0.301.92%15.8916.2115.88306.98 k
iShares, Incorporated- Shares MSCI Taiwan Index Fund  EWT8.84 0.414.86%8.668.918.6514.22 m
iShares United Kingdom Index Fund  EWU11.32 0.565.20%11.1911.4611.141.13 m
iShares Trust Nasdaq Biotech Index Fund- Shs Nasdaq Biotechnology Index Fund  IBB65.47 0.520.80%66.3866.3865.042.18 m
iShares Trust NYSE 100 Index Fund  NY43.30 1.002.36%43.3343.7941.3034.93 k
iShares Trust NYSE Compsite Index Fund  NYC48.14 1.513.24%48.0049.019948.0052.77 k
iShares Trust Russell 1000 Growth Index Fund  IWF36.70 0.952.66%36.5537.4336.465.74 m
iShares Trust- Shares Russell 1000 Index Fund  IWB45.45 1.242.80%45.3346.1145.129.48 m
iShares Russell 1000 Value Index Fund  IWD42.68 1.222.94%42.7043.2842.44193.89 m
iShares, Incorporated- Shares Russell 2000 Growth Index Fund  IWO48.61 2.044.38%47.9949.3747.612.77 m
iShares Trust Russell 2000 Index Fund  IWM44.92 2.145.00%44.1245.5743.8292.9 m
iShares, Incorporated- Shares Russell 2000 Value Index Fund  IWN42.33 2.335.82%41.3942.7841.122.82 m
iShares Inc. Russell 3000 Growth Index Fund  IWZ29.82 0.873.01%29.6130.3029.525128.85 k

StockWatchdelayed 20 minutes

Name SymbolLastTickChg% ChgOpenHighLowVolume
iShares Trust Russell 3000 Index Fund  IWV48.44 1.623.46%48.0148.9947.83014.4 m
iShares, Incorporated- Shares Russell 3000 Value Index fund  IWW55.63 1.612.98%55.6756.4555.4078.09 k
Russell Microcap Index Fund  IWC28.22 1.224.52%27.7628.58427.51120.3 k
iShares Trust Russell Midcap Growth Index Fund - ETF  IWP31.97 1.434.68%31.4032.364431.311.17 m
iShares Trust Russell Midcap Index Fund- ETF  IWR57.15 2.113.83%56.5157.9956.351.99 m
iShares Trust Russell Midcap Value Index Fund  IWS25.34 0.963.94%25.0325.5724.953.0 m
iShares S&P 100 Index Fund  OEF39.30 0.872.26%39.4039.9639.162.73 m
iShares S&P 1500 Index Fund  ISI37.20 0.932.56%37.2037.8437.11867.79 k
iShares Trust S&P 500 Growth Index Fund  IVW43.65 1.142.68%43.5344.3743.351.65 m
iShares Trust- Shares S&P 500 Index Fund  IVV83.63 2.372.92%83.2884.8382.9510.1 m
iShares S&P 500 Value Index Fund  IVE39.24 1.153.02%39.2039.7738.961.28 m
iShares Trust- Shares S&P Europe 350 Index Fund  IEV27.41 1.234.70%27.0527.9027.05325.03 k
iShares Trust- Shares S&P Global 100 Index Fund  IOO44.61 1.463.38%44.3545.3444.35184.13 k
iShares Trust S&P Global Energy Sector Index Fund- ETF  IXC28.18 1.214.49%28.0928.6027.9191.47 k
iShares Trust S&P Global Financial Sector Index Fund- ETF  IXG29.68 1.816.49%29.2030.8528.87263.05 k
iShares Trust S&P Global Healthcare Index Fund- ETF  IXJ39.99 0.070.18%40.5040.595239.9887.99 k
iShares Trust S&P Global Technology Sector Index Fund- ETF  IXN39.95 1.483.85%39.0940.6139.0981.18 k
iShares Trust S&P Global Telecommunications Sector Index Fund- ETF  IXP46.29 0.962.12%45.7546.9145.0732.05 k
iShares S&P LatinAmerica 40 Index- ETF  ILF28.18 1.626.10%27.5528.4227.392.58 m
iShares S&P MidCap 400 Growth Index Fund  IJK55.25 2.214.17%54.5456.0954.40264.23 k
iShares Trust S&P MidCap 400 Index Fund  IJH51.35 1.973.99%50.7252.0950.541.69 m
iShares, Incorporated- Shares S&P Mid Cap 400 Value Index  IJJ46.74 1.934.31%46.0647.3445.97308.87 k
iShares Trust S&P SmallCap 600 Index  IJR38.98 1.804.84%38.3439.6338.102.09 m
iShares, Incorporated- Shares S&P SmallCap 600 Value Index  IJS41.74 1.904.77%40.9742.3740.00146.69 k
iShares, Incorporated- Shares S&P SmallCap600 Growth Index Fund  IJT40.54 1.824.70%39.9041.2239.655167.47 k
iShares Tr S&P/TOPIX 150 Index Fund- ETF  ITF36.48 1.373.90%36.3836.8436.28386.89 k
Market 2000+ Holdrs  MKH40.69 1.634.17%40.80640.80640.69200
Select Sector SpdrMaterials  XLB23.51 0.853.75%23.5423.8823.197.88 m
Midcap Spdrs  MDY93.61 3.814.24%92.3794.8992.0112.69 m
PowerShares QQQ Trust Series I  QQQQ31.76 0.993.22%31.3432.2731.23212.21 m
Oil Service Holdrs  OIH78.94 4.035.38%78.6881.1778.4115.48 m
Pharmaceutical Holdrs  PPH56.42 -0.39-0.69%57.6257.7256.34587.3 k
Powershares ETF Aerospace & Defense Portfolio  PPA12.42 0.484.02%12.2112.619812.2165.92 k
Powershares Dividend Achievers Portfolio  PFM9.96 0.272.79%10.0010.109.92896.3 k
Powershares Dynamic Biotechnology & Genome Portfolio  PBE12.76 0.181.43%12.8112.9912.72223.42 k
Powershares Dynamic Building & Construction Portfolio  PKB9.86 0.485.12%9.8610.119.5659.0 k
Powershares ETF Dynamic Energy Exploration & Production Portfolio  PXE12.86 0.705.76%12.5213.020512.5231.54 k
Powershares ExchangeTraded Fund Trust  PBJ12.12 0.31012.63%12.2412.2812.0131.48 k
Powershares Dynamic Hardware & Consumer Electronics Portfolio  PHW8.35 0.44165.58%8.338.358.33475
Powershares ExchangeTraded Fund Trust  PIC11.464 0.27242.43%11.5911.590111.4011.3 k
PowerShares Exchange-Traded Funds Trust Dynamic Large Cap Growth Portfolio  PWB10.67 0.282.69%10.6610.7910.5692.53 k
PowerShares Exchange-Traded Funds Trust Dynamic Large Cap Value Portfolio  PWV13.08 0.352.75%13.0013.2712.947245.08 k
Powershares ExchangeTraded Fund Trust  PEJ9.40 0.525.86%9.139.559.1244.05 k
PowerShares Exchange-Traded Fund Trust- PowerShares Exchange Dynamic Market Ptfl  PWC30.56 0.692.31%30.4631.0630.4268.1 k
Powershares Dynamic Media Portfolio  PBS7.3332 0.39225.65%7.307.33327.292.46 k
PowerShares Exchange-Traded Funds Trust Dynamic Mid Cap Growth Portfolio  PWJ13.41 0.372.84%13.3613.6713.3462.35 k
PowerShares Exchange-Traded Funds Trust Dynamic Mid Cap Value Portfolio  PWP10.19 0.32273.27%10.13710.366410.13731.38 k
PowerShares Exchange-Traded Fund Dynamic Networking Portfolio  PXQ11.91 0.494.29%11.5612.1111.5626.29 k
Powershares ETF Dynamic Oil Services Portfolio  PXJ11.06 0.625.94%10.8311.3410.83116.54 k
PowerShares Exchange-Trade Fund Trust - PowerShares Exchange Dynamic OTC Ptfl.  PWO31.74 1.12993.69%31.4132.185431.4111.79 k

StockWatchdelayed 20 minutes

Name SymbolLastTickChg% ChgOpenHighLowVolume
Powershares ExchangeTraded Fund Trust  PJP14.05 0.020.14%14.3914.3914.0439.63 k
Powershares ETF Dynamic Retail Portfolio  PMR13.55 0.463.51%13.2413.8113.2492.74 k
PowerShares Exchange-Traded Fund Dynamic Semiconductors Portfolio  PSI9.86 0.282.92%9.7210.049.7061.62 k
PowerShares Exchange-Traded Funds Trust Dynamic Small Cap Growth Portfolio  PWT10.00 0.454.71%9.8010.119.8013.47 k
PowerShares Exchange-Traded Funds Trust Dynamic Small Cap Value Portfolio  PWY9.64 0.5025.49%9.369.7529.3648.93 k
PowerShares Exchange-Traded Fund Dynamic Software Portfolio  PSJ14.47 0.402.84%15.3115.3114.37269.79 k
Powershares ETF Trust- Dynamic Telecom & Wireless Portfolio  PTE10.8568 0.52985.13%10.830111.0610.83017.34 k
Powershares ETF Dynamic Utilities Portfolio  PUI13.32 0.211.60%13.3913.496413.1719.95 k
Powershares ExchangeTraded Fund Trust  PRF31.08 1.234.12%31.0131.6430.9673.39 k
Powershares Water Resource Portfolio  PHO12.70 0.564.61%12.4512.9712.40452.3 k
Powershares Golden Dragon Halter Usx China Portfolio  PGJ15.99 0.775.06%15.8916.2915.72745.36 k
Powershares High Growth Rate Dividend Achievers Portfolio  PHJ8.238 0.30163.80%8.188.2528.1719.52 k
Powershares ExchangeTraded Fund Trust  PEY5.68 0.224.03%5.745.745.618150.67 k
Powershares ExchangeTraded Fund Trust  PID9.46 0.394.30%9.369.669.3488.81 k
Powershares ETF Lux Nanotech Portfolio  PXN7.4588 0.22343.09%7.457.617.4457.89 k
Powershares ExchangeTraded Fund Trust  PIV9.25 0.161.76%9.359.39999.2433.49 k
PowerShares Exchange-Traded Funds Trust WilderHill Clean Energy Portfolio  PBW8.19 0.263.28%8.218.448.16414.14 k
PowerShares Exchange-Traded Funds Trust Zacks Micro Cap Portfolio  PZI7.46 0.344.78%7.317.64997.3130.17 k
Regional Bank Holdrs Trust  RKH52.75 0.841.62%54.5654.9651.455.93 m
Retail Holdrs Trust  RTH77.68 2.633.50%76.1179.0476.119.15 m
Rydex Russell Top 50 Etf  XLG65.17 1.432.24%65.2466.2164.91179.54 k
Rydex S&P Equal Weight Etf  RSP26.41 1.114.39%26.4326.7725.641.41 m
Semiconductor Holdrs  SMH19.50 0.764.06%19.1719.8519.0312.8 m
Software Holdrs Trust  SWH31.12 0.521.70%31.1131.8931.119.2 k
Spdr S&P Dividend Etf  SDY35.55 1.203.49%35.5436.0135.11280.72 k
Spdr S&P 500  SPY83.43 2.372.92%83.0884.6181.1296476.16 m
Spdr Index  FEZ29.14 1.465.27%28.6029.6328.58135.36 k
Spdr Dj Global Titans Etf  DGT43.165 1.2252.92%43.1244.0443.08019.11 k
Spdr Index  FEU25.34 1.164.80%25.0725.6425.0712.4 k
Spdr Dj Wilshire Small Cap Etf  DSC35.14 1.8835.66%34.394735.4334.394713.13 k
Spdr Dj Wilshire Small Cap Growth Etf  DSG55.704 3.0935.88%54.8556.52454.856.26 k
Spdr Dj Wilshire Small Cap Value Etf  DSV38.18 1.875.15%37.4438.5937.37654.29 k
Spdr Dj Wilshire Large Cap Growth Etf  ELG35.73 1.113.21%35.3736.453735.3718.73 k
Spdr Dj Wilshire Large Cap Etf  ELR38.65 0.982.60%39.0539.2838.6515.31 k
Spdr Dj Wilshire Large Cap Value Etf  ELV44.09 0.942.18%44.3244.8544.0920.16 k
Spdr Dj Wilshire Mid Cap Growth Etf  EMG39.45 1.82994.86%39.0439.80638.8216.72 k
Spdr Dj Wilshire Mid Cap Etf  EMM32.36 1.3954.51%32.0532.6931.949.36 k
Spdr Dj Wilshire Mid Cap Value Etf  EMV30.16 0.000.00%N/AN/AN/A0
Spdr Dj Wilshire Reit Etf  RWR27.98 2.057.91%26.8628.4126.541.38 m
Spdr Dj Wilshire Total Market Etf  TMW60.75 1.712.90%60.6061.7560.4724.72 k
streettracks Gold  GLD88.80 -2.23-2.45%88.7589.3687.9224.81 m
Spdr Kbw Bank Etf  KBE14.66 0.201.38%15.4515.4914.4318.25 m
Spdr Kbw Capital Markets Etf  KCE27.06 1.094.20%26.8327.3526.7526223.53 k
Spdr Kbw Insurance Etf  KIE21.10 0.562.73%21.2821.6021.04379.23 k
Spdr Morgan Stanley Technology Etf  MTK38.19 1.24163.36%37.7439.0837.7411.6 k
Spdr S&P Biotech Etf  XBI47.22 0.0750.16%48.0248.0247.05228.87 k
Spdr Homebuilders Etf  XHB11.45 0.575.24%11.2411.7211.168.85 m
Stream Global Services Inc  OOO3.00 0.000.00%N/AN/AN/A0
Spdr S&P Semiconductor Etf  XSD29.01 0.91013.24%29.1029.4628.77150.38 k
Select Sector SpdrTechnology  XLK16.48 0.422.62%16.3516.8316.267.32 m

StockWatchdelayed 20 minutes

Name SymbolLastTickChg% ChgOpenHighLowVolume
Telecom Holdrs Trust  TTH23.99 0.612.61%23.8124.431523.6774.5 k
Utilities Holdrs  UTH84.66 1.221.46%84.7685.5583.379.1 k
Select Sector SpdrUtilities  XLU25.98 0.331.29%26.1826.3325.599.31 m
Vanguard Consumer Discretionary Etf  VCR32.34 1.5775.13%31.5032.8631.3855.53 k
Vanguard Consumer Staples Etf  VDC53.74 1.182.25%53.5454.45253.3484.66 k
Vanguard Emerging Markets Etf  VWO25.80 1.385.65%25.4326.15525.407.13 m
Vanguard Energy Etf  VDE64.24 2.604.22%63.9465.337463.73107.0 k
Vanguard European Etf  VGK34.19 1.464.46%33.9434.775633.88342.2 k
Vanguard Extended Market Etf  VXF30.02 1.244.31%29.6430.5029.48133.66 k
Vanguard Financials Etf  VFH19.74 0.603.13%20.0420.1419.501.42 m
Vanguard Growth Etf  VUG39.17 1.173.08%38.8439.74938.72489.53 k
Vanguard Health Care Etf  VHT42.22 0.060.14%42.8842.8842.2289.51 k
Vanguard Industrials Etf  VIS36.38 1.965.69%35.4637.029535.4651.27 k
Vanguard Information Technology Etf  VGT37.08 1.062.94%36.7337.82236.59209.7 k
Vanguard Index Funds  VV37.73 1.062.89%37.6638.3437.48522.82 k
Vanguard Materials Etf  VAW46.69 1.493.30%46.4447.5046.21120.12 k
Vanguard MidCap Etf  VO41.65 1.583.94%41.2342.2941.10744.42 k
Vanguard Pacific Etf  VPL40.03 1.604.16%39.8340.58439.70450.09 k
Vanguard Specialized Funds  VNQ25.90 1.757.25%25.0226.1824.492.35 m
Vanguard SmallCap Growth Etf  VBK40.75 1.724.41%40.1341.5040.04129.26 k
Vanguard SmallCap Value Etf  VBR37.25 1.855.23%36.6837.7936.40200.92 k
Vanguard SmallCap Etf  VB39.28 1.744.64%38.7739.8038.40217.17 k
Vanguard Telecommunication Services Etf  VOX46.83 1.743.86%46.1847.6946.10111.6 k
Vanguard Total  VTI41.58 1.213.00%41.3542.198641.235.42 m
Vanguard Utilities Etf  VPU54.05 0.731.37%54.4254.7353.3073.76 k
Vanguard Value Etf  VTV35.78 1.053.02%35.8836.2935.60684.91 k
Wireless Holdrs  WMH40.10 1.614.18%40.0140.1040.01200
金币:
奖励:
热心:
注册时间:
2006-7-3

回复 使用道具 举报

 楼主| 发表于 2009-4-3 07:14 | 显示全部楼层
DO YOU KNOW WHAT THESE CHART PATTERNS ALL HAVE IN COMMON?
THEY WERE ALL PATTERNS IN SOME OF THE BIGGEST MARKET MOVES!
          WILL YOU RECOGNIZE THE NEXT PATTERN?  IF SO, WILL YOU KNOW HOW TO TRADE IT?


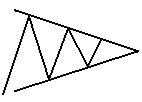
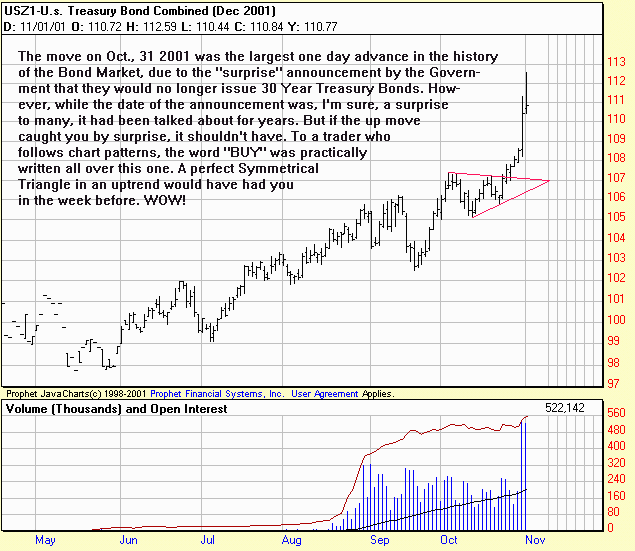
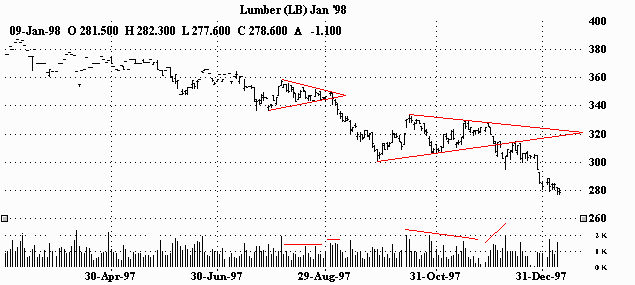
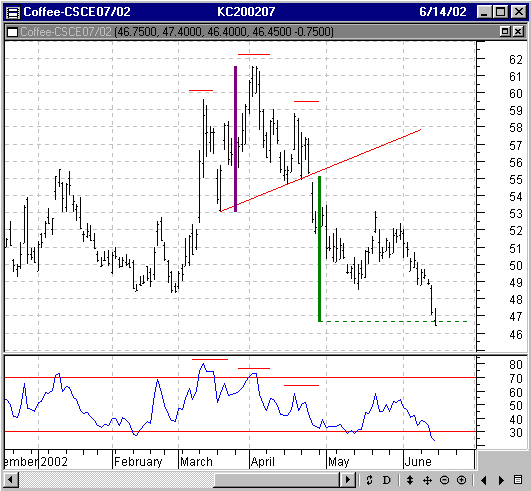
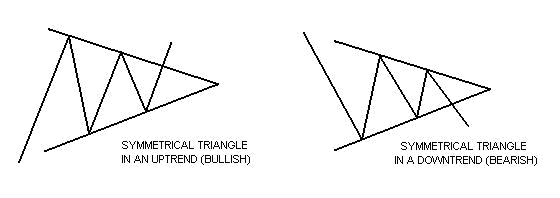
Symmetrical triangles can be characterized as areas of indecision.  A market pauses and future direction is questioned.  Typically, the forces of supply and demand at that moment are considered nearly equal.  Attempts to push higher are quickly met by selling, while dips are seen as bargains. Each new lower top and higher bottom becomes more shallow than the last, taking on the shape of a sideways triangle.  (It's interesting to note that there is a tendency for volume to diminish during this period.)  Eventually, this indecision is met with resolve and usually explodes out of this formation (often on heavy volume.)  Research has shown that symmetrical triangles overwhelmingly resolve themselves in the direction of the trend.  With this in mind, symmetrical triangles in my opinion, are great patterns to use and should be traded as continuation patterns.  (Chart examples of symmetrical triangle patterns using commodity charts.)  (Stock charts.) Futures and options trading carries significant risk and you can lose some, all or even more than your investment. Stock trading involves high risks and you can lose a significant amount of money. The information contained here was gathered from sources deemed reliable, however, no claim is made as to its accuracy or content. This does not contain specific recommendations to buy or sell at particular prices or times, nor should any of the examples presented be deemed as such. There is a risk of loss in trading futures and futures options and stocks and stocks options and you should carefully consider your financial position before making any trades.  The reference to statistical probabilities does not pertain to profitability, but rather to the direction of the market. The size and the duration of the markets move, as well as entry and exit prices ultimately determines success or failure in a trade and is in no way represented in these statistics.  This is not, nor is it intended to be, a complete study of chart patterns or technical analysis and should not be deemed as such.


CHART EXAMPLES OF SYMMETRICAL TRIANGLE PATTERNS / COMMODITIES

SYMMETRICAL TRIANGLE IN A NEW UPTREND (BULLISH)
Symmetrical triangle in an uptrend (bullish). Measure the base, add it to the breakout point and calculate your target. It doesn't get much easier than this.

SYMMETRICAL TRIANGLE IN AN UPTREND (BULLISH)
This was probably the biggest "gimme" I've seen all year (2001). Perfect Symmetrical Triangle in an uptrend. While I doubt anybody could have accurately predicted the date of the Government's announcement to stop issuing 30 Year Bonds, being in and getting "lucky" was a pretty good bet. Notice the enormous jump in volume too! This just goes to show that you don't have to know the news to take advantage of the markets. Just read the charts. Like the commercial says, ..."it's in there".  

SYMMETRICAL TRIANGLE IN THE BEGINNING OF AN UPTREND (BULLISH)
The symmetrical triangle in the beginning of this uptrend signaled even better things to come.  Notice the leveling of the volume during the formation of the triangle and the burst of activity on the breakout.

SYMMETRICAL TRIANGLES IN AN UPTREND (BULLISH)
Plenty of opportunities to get in on this one.  The symmetrical triangles were all resolved to the upside.  In this example you'll notice that volume is viewed with an on balance volume or OBV indicator (a running cumulative total of positive and negative volume numbers) instead of the typical vertical bars that run along the bottom of the chart.  In some markets with chronically light volume readings, it is sometimes easier to view the volume changes with an OBV line.  As you can see, there is a general leveling off of volume in the patterns with an increase in volume on the breakouts.  

SYMMETRICAL TRIANGLE IN AN UPTREND (BULLISH)
The symmetrical triangle in this uptrend continued the move higher.  Notice how the volume dried up during the formation of the pattern with an explosion of new activity on the breakout!

SYMMETRICAL TRIANGLE IN AN UPTREND (BULLISH)
High Grade Copper / Nearest Future Chart (March '00) Weekly
Here's a weekly chart with a great example of a symmetrical triangle as a continuation pattern in an uptrend.  Notice the how the volume falls during the beginning of its consolidation, starts to pick up on its move higher and jumps on its breakout!  (Also, look at the weak volume reading on the down week (the weakest of the pattern) just prior to its eventual breakout to the upside. Very telling.)

SYMMETRICAL TRIANGLE IN A DOWNTREND (BEARISH)
Symmetrical triangle in a downtrend.  This pattern continued the move lower in earnest!  Notice the volume diminish during the period of indecision and then jump on its resolve!

SYMMETRICAL TRIANGLE IN A DOWNTREND (BEARISH)
Symmetrical triangle in a downtrend, bearish. This triangle perfectly measured out the ensuing move lower.

SYMMETRICAL TRIANGLE IN THE BEGINNING OF A DOWNTREND (BEARISH)
Symmetrical triangle in the beginning of a downtrend.  Notice the moving average (simple 40-day) has a downward bias. Volume is light in the triangle but very heavy on the breakout.

SYMMETRICAL TRIANGLES IN A DOWNTREND (BEARISH)
Symmetrical triangles in a downtrend.  Each pause seems to resolve itself with renewed bearish conviction. Volume lightens up during the triangle formations and picks up again on the breakouts.
The information contained here was gathered from sources deemed reliable, however, no claim is made as to its accuracy or content. This does not contain specific recommendations to buy or sell at particular prices or times, nor should any of the examples presented be deemed as such. There is a risk of loss in trading futures and futures options and you should carefully consider your financial position before making any trades.  The reference to statistical probabilities does not pertain to profitability, but rather to the direction of the market. The size and the duration of the markets move, as well as entry and exit prices ultimately determines success or failure in a trade and is in no way represented in these statistics. Furthermore,  no representation is being made that any of the examples shown resulted in actual trades. This is not, nor is it intended to be, a complete study of chart patterns or technical analysis and should not be deemed as such.
Futures and options trading carries significant risk and you can lose some, all or even more than your investment.


[ 本帖最后由 hefeiddd 于 2009-4-3 07:17 编辑 ]
金币:
奖励:
热心:
注册时间:
2006-7-3

回复 使用道具 举报

 楼主| 发表于 2009-4-3 07:18 | 显示全部楼层
CHART EXAMPLES OF SYMMETRICAL TRIANGLE
PATTERNS / STOCKS

SYMMETRICAL TRIANGLE IN AN UPTREND (BULLISH)
D / Dominion Resources, Inc.
Symmetrical triangle in an uptrend (bullish). Dominion Resources, Inc. (D), from PRS, Vol. 3, No. 17, for the week of 5/12/03. (This is so easy.)

SYMMETRICAL TRIANGLE IN AN UPTREND (BULLISH)
FLSH / M-Systems Flash Disk Pioneers, Ltd.
Symmetrical triangle in an uptrend (bullish). M-Systems Flash Disk Pioneers, Ltd. (FLSH), from PRS, Vol. 3, No. 17, for the week of 5/12/03. Measure the base, add it to the breakout point and determine your measured price target. (Notice how the volume picked-up on its breakout and continued to increase on the follow-thru higher.)

SYMMETRICAL TRIANGLE IN AN UPTREND (BULLISH)
ISLE / Isle of Capri Casinos, Inc.
Symmetrical triangle in an uptrend (bullish). Isle of Capri Casinos, Inc. (ISLE), from PRS, Vol. 2, No. 12, for the week of 4/8/02. Measure the base, add it to the breakout point and determine your measured price target. (Look at the huge volume on its breakout day.)

SYMMETRICAL TRIANGLE IN AN UPTREND (BULLISH)
PBY / Pep Boys - Manny, Moe & Jack
Symmetrical triangle in an uptrend (bullish). Notice how the previous resistance (green trendline), became support later on. (Trends and trendlines.) After its pull-back from its first 52 week high in July, PBY then regrouped and found new buying. It then pushed through resistance and consolidated along that trendline for about a month. (Notice how the volume flattened out as the market was basing and forming the triangle consolidation.) Finally, after one last re-test of the trendline resistance, which had now become support, the price and volume started to climb, culminating into an explosive breakout, accompanied by an equally explosive jump in volume. This is a text book example on so many levels.

SYMMETRICAL TRIANGLE IN AN UPTREND (BULLISH)
GFF / Griffon Corp.
Symmetrical triangle in an uptrend. (I've numbered the points (1-4). A triangle of course needs 4 points.) Notice how the volume diminishes during the formation of the pattern, then jumps on the market's successful breakout.

SYMMETRICAL TRIANGLE IN AN UPTREND (BULLISH)
RAIL / Railamerica, Inc.
Symmetrical triangle in an uptrend (bullish). Clear cut pattern with a typical result. Notice how the On Balance Volume (OBV) indicator also confirms the move, rising sharply with the price.

SYMMETRICAL TRIANGLE IN AN UPTREND (BULLISH)
TRDO / Intrado, Inc.
Symmetrical triangle in an uptrend. This, this is also a great example on the importance of volume. (More on volume.) You have the typical increase in volume on the breakout, but volume diminishes on the advance (opposite of what a strong market should do), which is a good foreshadowing of an impending correction. As the correction begins, notice how the volume then picks up. Also, not a characteristic of a strong market, but rather a market where there are more sellers than buyers (bearish). Pay attention to these things to alert you to waning trends and beginnings of new ones.

SYMMETRICAL TRIANGLE IN AN UPTREND (BULLISH)
DPL / The Dayton Power and Light Company, Inc.
Symmetrical triangle in an uptrend. After a good advance, this symmetrical triangle gave a nice opportunity to hop on board.
SYMMETRICAL TRIANGLE IN A DOWNTREND (BEARISH)
DE / Deere & Co.
Symmetrical triangle in a downtrend (bearish). From PRS, Vol. 3, No. 2, for the week of 1/13/03.
The information contained here was gathered from sources deemed reliable, however, no claim is made as to its accuracy or content. This does not contain specific recommendations to buy or sell at particular prices or times, nor should any of the examples presented be deemed as such. There is a risk of loss in trading stocks and stocks options and you should carefully consider your financial position before making any trades.  The reference to statistical probabilities does not pertain to profitability, but rather to the direction of the market. The size and the duration of the markets move, as well as entry and exit prices ultimately determines success or failure in a trade and is in no way represented in these statistics. Furthermore,  no representation is being made that any of the examples shown resulted in actual trades. This is not, nor is it intended to be, a complete study of chart patterns or technical analysis and should not be deemed as such.
Stock trading involves high risks and you can lose a significant amount of money.
金币:
奖励:
热心:
注册时间:
2006-7-3

回复 使用道具 举报

 楼主| 发表于 2009-4-3 07:21 | 显示全部楼层
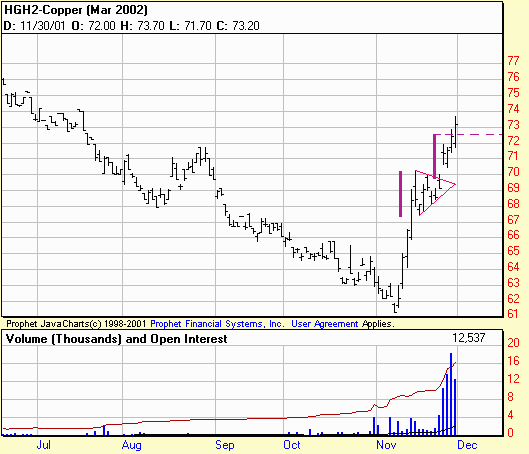
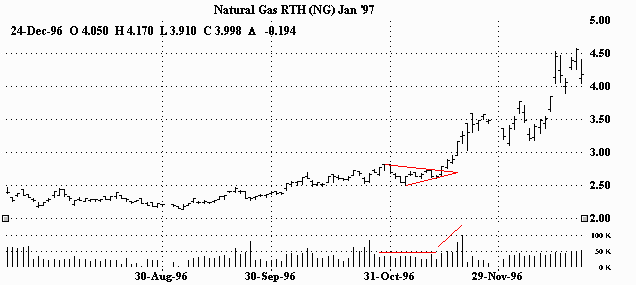
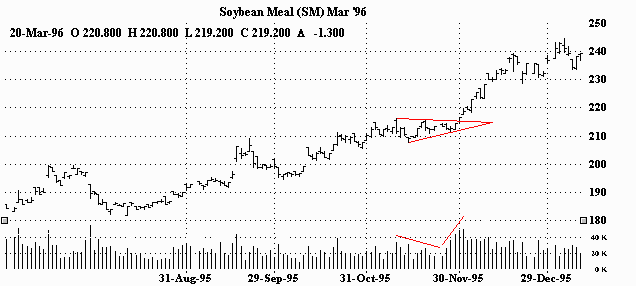
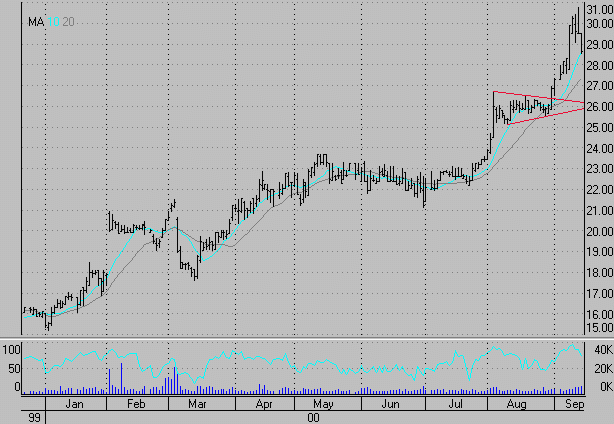
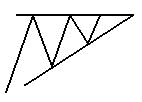
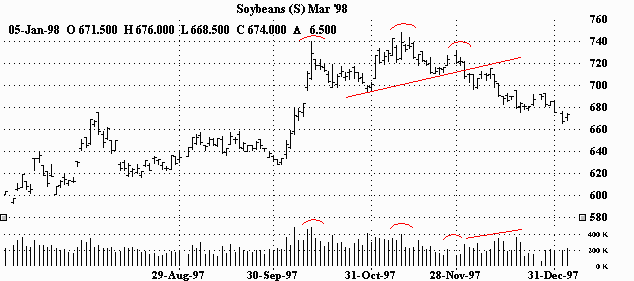
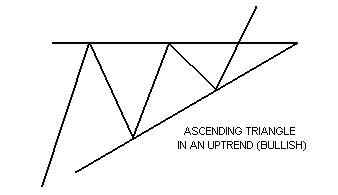
The ascending triangle is a variation of the symmetrical triangle.  Ascending triangles are generally considered bullish and are most reliable when found in an uptrend.  The top part of the triangle appears flat, while the bottom part of the triangle has an upward slant.  In ascending triangles, the market becomes overbought and prices are turned back.  Buying then re-enters the market and prices soon reach their old highs, where they are once again turned back.  Buying then resurfaces, although at a higher level than before. Prices eventually break through the old highs and are propelled even higher as new buying comes in.  (As in the case of the symmetrical triangle, the breakout is generally accompanied by a marked increase in volume.) (Chart examples of ascending triangle patterns using commodity charts.)  (Stock charts.) Futures and options trading carries significant risk and you can lose some, all or even more than your investment. Stock trading involves high risks and you can lose a significant amount of money. The information contained here was gathered from sources deemed reliable, however, no claim is made as to its accuracy or content. This does not contain specific recommendations to buy or sell at particular prices or times, nor should any of the examples presented be deemed as such. There is a risk of loss in trading futures and futures options and stocks and stocks options and you should carefully consider your financial position before making any trades.  The reference to statistical probabilities does not pertain to profitability, but rather to the direction of the market. The size and the duration of the markets move, as well as entry and exit prices ultimately determines success or failure in a trade and is in no way represented in these statistics.  This is not, nor is it intended to be, a complete study of chart patterns or technical analysis and should not be deemed as such.


CHART EXAMPLES OF ASCENDING TRIANGLE PATTERNS / COMMODITIES ASCENDING TRIANGLE IN AN UPTREND (BULLISH) 
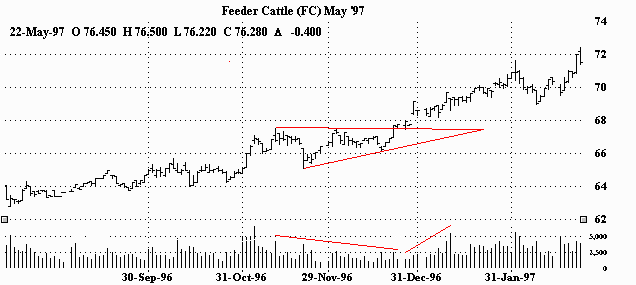
Ascending triangle in an uptrend.  Volume falls off during the formation, picks up and then expands on the breakout and ensuing upmove. ASCENDING TRIANGLE IN AN UPTREND (BULLISH) 
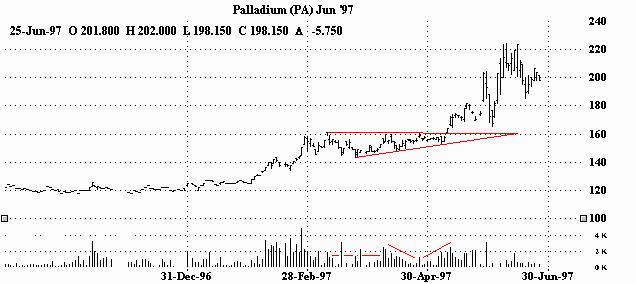
An ascending triangle in an uptrend.  After nearly two months of indecision, the market aggressively resolves itself in the direction of the trend.  As for volume, other than a few spikes of activity within the pattern, there is a general lessening of participation with a marked increase on the breakout. ASCENDING TRIANGLE IN AN UPTREND (BULLISH)
Monthly Continuation (or Splice) Chart This ascending triangle was over five years in the making.  (It's enormous!)  The length of time it took to form as well as the enormity of the pattern could potentially hold added significance.  (Remember, this is a monthly chart.)  We're using the on balance volume or OBV indicator to view the volume on this chart. As described previously, OBV is a running cumulative total of positive and negative volume numbers. You can see the volume reading rise and fall with the price.  In fact, you can even chart the OBV and see it take on the same pattern (ascending triangle) as the market itself.  Notice the price and volume both breaking out of the pattern simultaneously.  ASCENDING TRIANGLE IN AN UPTREND (BULLISH) An ascending triangle in an uptrend.  Diminishing volume during the pattern and a jump in volume on the breakout. ASCENDING TRIANGLE IN AN UPTREND (BULLISH) 
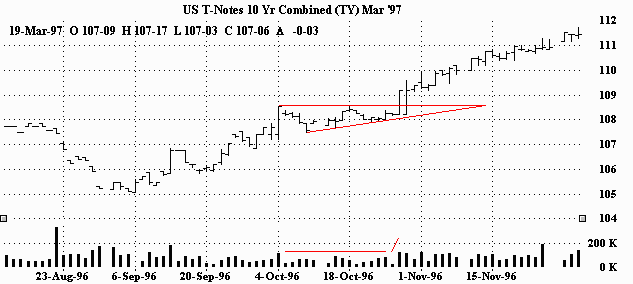
The ascending triangle in this uptrend continued the move higher.  Volume wanes a bit during the formation and then picks up on the breakout.  The march higher is also accompanied by sustained volume. The information contained here was gathered from sources deemed reliable, however, no claim is made as to its accuracy or content. This does not contain specific recommendations to buy or sell at particular prices or times, nor should any of the examples presented be deemed as such. There is a risk of loss in trading futures and futures options and you should carefully consider your financial position before making any trades.  The reference to statistical probabilities does not pertain to profitability, but rather to the direction of the market. The size and the duration of the markets move, as well as entry and exit prices ultimately determines success or failure in a trade and is in no way represented in these statistics. Furthermore,  no representation is being made that any of the examples shown resulted in actual trades. This is not, nor is it intended to be, a complete study of chart patterns or technical analysis and should not be deemed as such.  
Futures and options trading carries significant risk and you can lose some, all or even more than your investment.


CHART EXAMPLES OF ASCENDING TRIANGLE PATTERNS / STOCKS

ASCENDING TRIANGLE IN AN UPTREND (BULLISH)
AAI / Airtran Holdings, Inc.
Ascending triangle in an uptrend (bullish). Look at how it powers out of the pattern. And on great confirming volume too. Classic.

ASCENDING TRIANGLE IN AN UPTREND (BULLISH)
ALLY / Alliance Gaming Corp.
Another perfect example of an ascending triangle in an uptrend with confirming volume. The volume diminishes during the formation of the triangle and explodes higher with the price of the stock as it breaks out to the upside.

ASCENDING TRIANGLE(S) IN AN UPTREND (BULLISH)
BBI / Blockbuster Inc.
Great examples of ascending triangles in an uptrend. Notice the explosive volume as it breaks through each pattern.  
The information contained here was gathered from sources deemed reliable, however, no claim is made as to its accuracy or content. This does not contain specific recommendations to buy or sell at particular prices or times, nor should any of the examples presented be deemed as such. There is a risk of loss in trading stocks and stocks options and you should carefully consider your financial position before making any trades.  The reference to statistical probabilities does not pertain to profitability, but rather to the direction of the market. The size and the duration of the markets move, as well as entry and exit prices ultimately determines success or failure in a trade and is in no way represented in these statistics. Furthermore,  no representation is being made that any of the examples shown resulted in actual trades. This is not, nor is it intended to be, a complete study of chart patterns or technical analysis and should not be deemed as such.
Stock trading involves high risks and you can lose a significant amount of money.
金币:
奖励:
热心:
注册时间:
2006-7-3

回复 使用道具 举报

 楼主| 发表于 2009-4-3 07:23 | 显示全部楼层
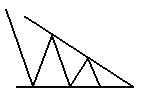
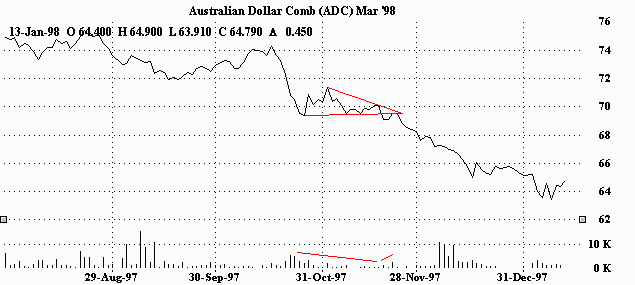
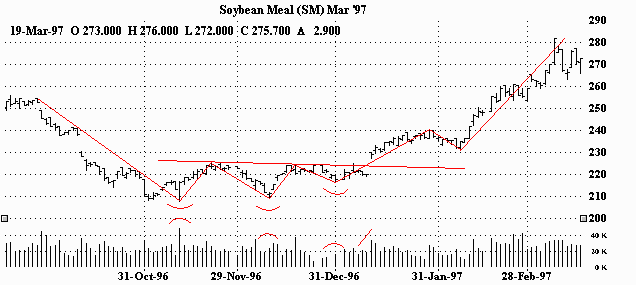
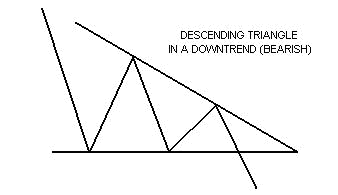
The descending triangle, also a variation of the symmetrical triangle, is generally considered to be bearish and is usually found in downtrends.  Unlike the ascending triangle, this time the bottom part of the triangle appears flat. The top part of the triangle has a downward slant. Prices drop to a point where they are oversold. Tentative buying comes in at the lows, and prices perk up.  The higher price however attracts more sellers and prices re-test the old lows. Buyers then once again tentatively re-enter the market. The better prices though, once again attract even more selling.  Sellers are now in control and push through the old lows of this pattern, while the previous buyers rush to dump their positions.  (And like the symmetrical triangle and the ascending triangle, volume tends to diminish during the formation of the pattern with an increase in volume on its resolve.)  (Chart examples of descending triangle patterns using commodity charts.)  (Stock charts.) Futures and options trading carries significant risk and you can lose some, all or even more than your investment. Stock trading involves high risks and you can lose a significant amount of money. The information contained here was gathered from sources deemed reliable, however, no claim is made as to its accuracy or content. This does not contain specific recommendations to buy or sell at particular prices or times, nor should any of the examples presented be deemed as such. There is a risk of loss in trading futures and futures options and stocks and stocks options and you should carefully consider your financial position before making any trades.  The reference to statistical probabilities does not pertain to profitability, but rather to the direction of the market. The size and the duration of the markets move, as well as entry and exit prices ultimately determines success or failure in a trade and is in no way represented in these statistics.  This is not, nor is it intended to be, a complete study of chart patterns or technical analysis and should not be deemed as such.


CHART EXAMPLES OF DESCENDING TRIANGLE PATTERNS

DESCENDING TRIANGLES IN A DOWNTREND (BEARISH)
These descending triangles presented two great opportunities to hop in on the downtrend.  While overall volume was noticeably larger in the second triangle than in the first, in both instances volume weakened during the pattern's formation and picked up on the breakout.

DESCENDING TRIANGLE IN THE BEGINNING OF A DOWNTREND (BEARISH)
This descending triangle is an interesting one.  First of all, it's in the very beginning of a downtrend. Second, it's preceded by three other bearish signals; a relatively small head and shoulders top (can you see it?), the flattening (and ultimately falling) of the moving average (simple 40-day) and the breaking of the trendline. Notice that within days of falling below the moving average and the trendline, the market broke through the bottom of the descending triangle and sold off sharply. Volume behaves accordingly, with activity diminishing during the formation of the pattern followed by a burst of activity on the breakout.

DESCENDING TRIANGLE IN A DOWNTREND (BEARISH)
Descending triangle in a downtrend (bearish). The market had been in a steady decline for months. This relatively brief pause served as only that; a relatively brief pause in a continuing downtrend. The clearly definable pattern gave great foreshadowing as to what was to come.

DESCENDING TRIANGLE IN A DOWNTREND (BEARISH)
Descending triangle in a downtrend.  This example uses a line chart instead of the more typical bar chart. Since the Australian Dollar is a relatively thinly traded futures contract, viewing is much easier with this type of format.  (A chart riddled with gaps do to illiquidity can be difficult to look at.)  However, the descending triangle is unmistakable, and is clearly just a brief pause before the market pushes lower.  And while it's not the easiest thing to see, there indeed is diminishing volume during the formation of the pattern and a pick-up on the breakout.  (Note the "big" increase in volume as the downtrend picks up speed later on.)

DESCENDING TRIANGLE IN A DOWNTREND (BEARISH)
An easily recognizable descending triangle in a downtrend.  After about a month long period of indecision, the market resolves itself in the direction of the trend (down.)  Volume dries up in the triangle with a sizable increase on the breakout and further dump.

DESCENDING TRIANGLES IN A DOWNTREND (BEARISH)
These descending triangles gave a couple of good chances to catch this one.  As the downtrend pauses, volume drops. When it continues (breakout), volume jumps.
The information contained here was gathered from sources deemed reliable, however, no claim is made as to its accuracy or content. This does not contain specific recommendations to buy or sell at particular prices or times, nor should any of the examples presented be deemed as such. There is a risk of loss in trading futures and futures options and you should carefully consider your financial position before making any trades.  The reference to statistical probabilities does not pertain to profitability, but rather to the direction of the market. The size and the duration of the markets move, as well as entry and exit prices ultimately determines success or failure in a trade and is in no way represented in these statistics. Furthermore,  no representation is being made that any of the examples shown resulted in actual trades. This is not, nor is it intended to be, a complete study of chart patterns or technical analysis and should not be deemed as such.
Futures and options trading carries significant risk and you can lose some, all or even more than your investment.
金币:
奖励:
热心:
注册时间:
2006-7-3

回复 使用道具 举报

 楼主| 发表于 2009-4-3 07:24 | 显示全部楼层
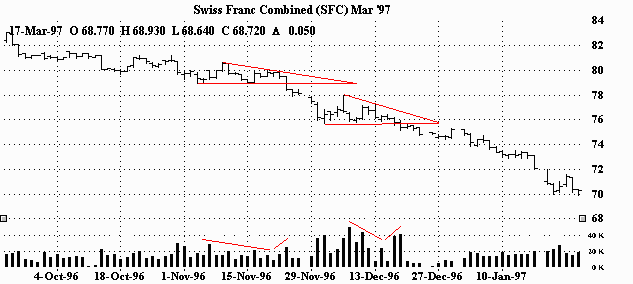
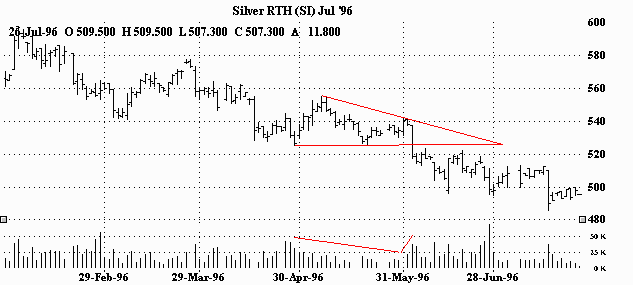
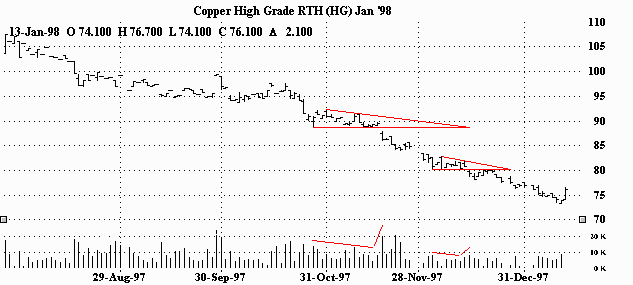
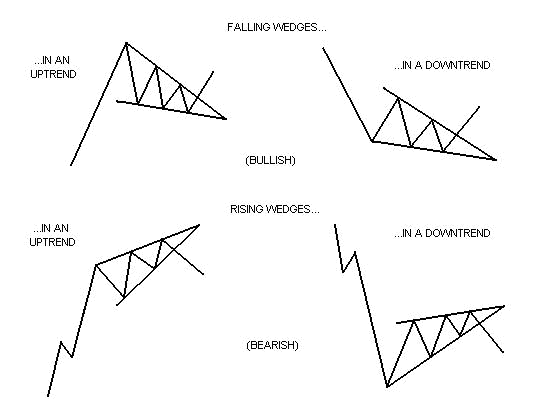
The wedge formation is also similar to a symmetrical triangle in appearance, in that they have converging trendlines that come together at an apex.  However, wedges are distinguished by a noticeable slant, either to the upside or to the downside.   (As with triangles, volume should diminish during its formation and increase on its resolve.) A falling wedge is generally considered bullish and is usually found in uptrends.  But they can also be found in downtrends as well.  The implication however is still generally bullish.  This pattern is marked by a series of lower tops and lower bottoms. A rising wedge is generally considered bearish and is usually found in downtrends.  They can be found in uptrends too, but would still generally be regarded as bearish.  Rising wedges put in a series of higher tops and higher bottoms.   (Chart examples of wedge patterns using commodity charts.)  (Stock charts.) Futures and options trading carries significant risk and you can lose some, all or even more than your investment. Stock trading involves high risks and you can lose a significant amount of money. The information contained here was gathered from sources deemed reliable, however, no claim is made as to its accuracy or content. This does not contain specific recommendations to buy or sell at particular prices or times, nor should any of the examples presented be deemed as such. There is a risk of loss in trading futures and futures options and stocks and stocks options and you should carefully consider your financial position before making any trades.  The reference to statistical probabilities does not pertain to profitability, but rather to the direction of the market. The size and the duration of the markets move, as well as entry and exit prices ultimately determines success or failure in a trade and is in no way represented in these statistics.  This is not, nor is it intended to be, a complete study of chart patterns or technical analysis and should not be deemed as such.


CHART EXAMPLES OF WEDGE PATTERNS / COMMODITIES FALLING WEDGE IN THE BEGINNING OF AN UPTREND (BULLISH) 
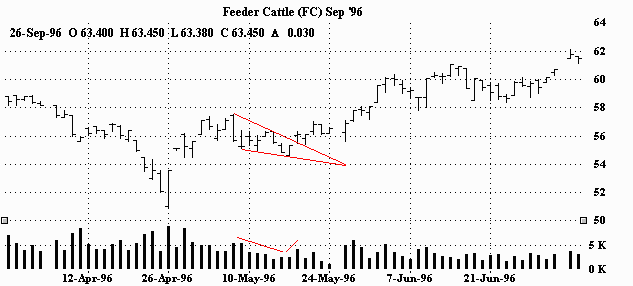
Here's a falling wedge in the very beginning of an uptrend.  As you can see, volume dissipates during the formation of the wedge pattern and then picks up on the breakout. FALLING WEDGE IN AN UPTREND (BULLISH) 
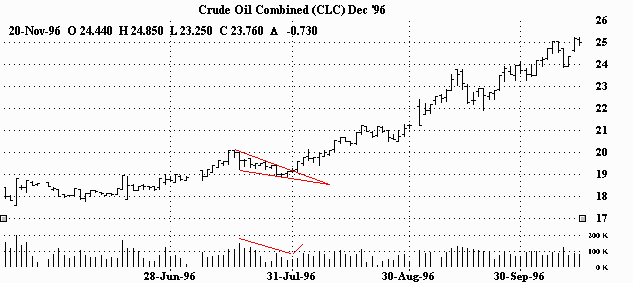
Falling wedge in an uptrend.  After more than a $2.00 rally, the market pauses before continuing higher for an impressive run. Volume dips during this pause and then picks up on the breakout and trek higher. FALLING WEDGE IN A DOWNTREND (BULLISH) Falling wedge in a downtrend.  This pattern was able to reverse the downtrend nicely.  Volume drops off in the wedge and then comes back as the market moves out of the pattern.   FALLING WEDGE IN A DOWNTREND (BULLISH) Falling wedge in downtrend.  Nice reversal.  After waning volume in the wedge, there's a good increase on the breakout. In fact, these good volume readings were able to sustain themselves during the move higher. RISING WEDGE IN AN UPTREND (BEARISH) The rising wedge put a stop to this uptrend.  Volume tails off as the trend struggles.  Volume expands as the market falls through the bottom of the wedge and the new downtrend begins. RISING WEDGE IN AN UPTREND (BEARISH) 
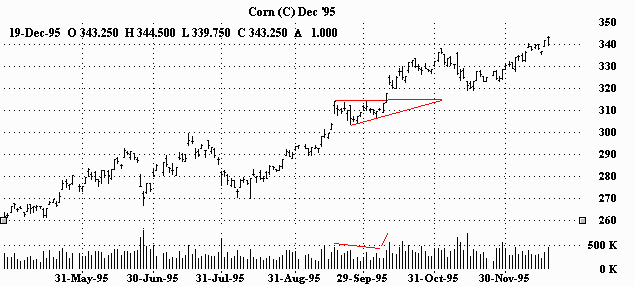
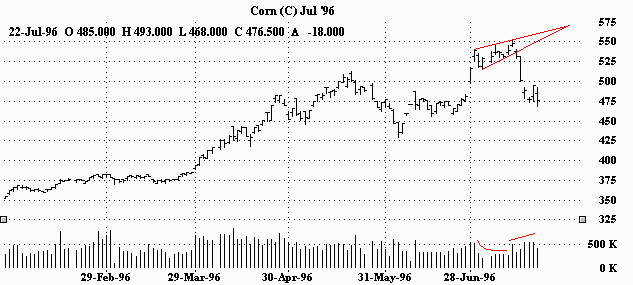
This rising wedge stopped corn dead in its tracks!  (As you can see, July corn went off the board shortly after the downside breakout, but nevertheless, lost more than 70 cents in just six days - WOW!)  As for volume, the story remains the same. Volume falls off in the wedge and jumps on the breakout. RISING WEDGE IN A DOWNTREND (BEARISH) 
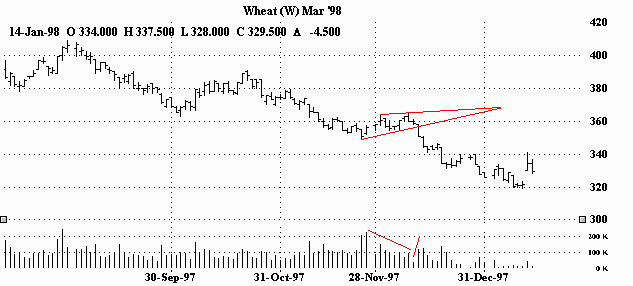
This rising wedge seemingly presented an area of indecision.  However, within a few weeks the market resolved itself in the direction of the trend (down.)  As usual, volume increases on the breakout after diminishing during the pattern. RISING WEDGE IN A DOWNTREND (BEARISH) 
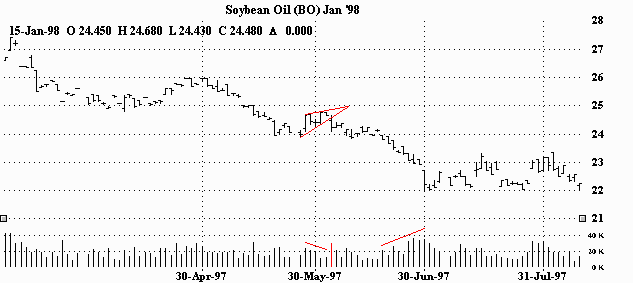
Rising wedge in a downtrend.  A short pause followed by renewed downside conviction.  And once again, volume dries up in the pattern and increases on the breakout.  (Notice how the volume really starts to pick up as the downtrend gains momentum shortly after the break.)
RISING WEDGE IN A DOWNTREND (BEARISH)
h
Japanese Yen (Nearest Future / March '00)
The Japanese yen, broke out of a rising wedge in a waning uptrend (new downtrend) and continued to move lower and lower. The wedge actually had a small false break, with a return move back into the pattern, but the wedge's upper parameter was never challenged and it quickly plunged through the bottom. Notice how the volume forecasted the down move. The volume increases on the first move off of the highs, then flattens (actually falls a bit) during the formation of the pattern. The volume then spikes up as the market collapses through the wedge.
chartpatterns.com's
The information contained here was gathered from sources deemed reliable, however, no claim is made as to its accuracy or content. This does not contain specific recommendations to buy or sell at particular prices or times, nor should any of the examples presented be deemed as such. There is a risk of loss in trading futures and futures options and you should carefully consider your financial position before making any trades.  The reference to statistical probabilities does not pertain to profitability, but rather to the direction of the market. The size and the duration of the markets move, as well as entry and exit prices ultimately determines success or failure in a trade and is in no way represented in these statistics. Furthermore,  no representation is being made that any of the examples shown resulted in actual trades. This is not, nor is it intended to be, a complete study of chart patterns or technical analysis and should not be deemed as such.
Futures and options trading carries significant risk and you can lose some, all or even more than your investment.


CHART EXAMPLES OF WEDGE PATTERNS / STOCKS

FALLING WEDGE IN AN UPTREND (BULLISH)
HLTH / WebMD Corp.
Falling wedge in an uptrend (bullish). From PRS, Vol. 2, No. 47, for the week of 12/30/02.

RISING WEDGE IN A NEW DOWNTREND (BEARISH),
(AFTER A BULLISH ASCENDING TRIANGLE IN AN UPTREND)
IMCL / ImClone Systems, Incorporated
After a bullish ascending triangle in an uptrend (from the Pattern Recognition Services Newsletter, Vol. 1, No. 2, for the week of 11/12/01),reached and surpassed it's measured move target of $69.76 (base of $6.88 added to the breakout point of $62.88 for a measured move target of $69.76), and actually surpassed it, the market then came crashing down, below the earlier surpassed price target (which had became your new support or stop-out point [see purple hashed line]), it then based in the same area as it's previous bullish consolidation. It quickly traced out a bearish rising wedge before just absolutely collapsing. The ensuing free-fall took place on huge volume. (Notice how the volume actually started picking up as it pulled back from it's highs. That alone was a signal that the bull run was waning.) The push below the 'old' price target on it's way down (your 'stop-out' point), was your signal to get out. The rising wedge formation was a clear foreshadowing of lower prices to come and to get short (or at least your last chance to get out). I'm sure many people rode this once 'winning' stock too long and ultimately turned a great and profitable bullish trade into a terrible loser. But if you followed chart pattern analysis, you probably would have done great, ... on both sides! For more information on chartpatterns.com's  Pattern Recognition Services Newsletter, click here.

RISING WEDGE IN A DOWNTREND (BEARISH)
CPN / Calpine Corp.
Just when you thought that it couldn't go any lower, ... it does. Rising wedge in a downtrend (bearish). Down over -$8.00 in just 5 days. (Notice the spike in volume on the lows of the pattern, the diminishing volume on the creep up and the huge jumps in volume on it's breakout and collapse lower!)
The information contained here was gathered from sources deemed reliable, however, no claim is made as to its accuracy or content. This does not contain specific recommendations to buy or sell at particular prices or times, nor should any of the examples presented be deemed as such. There is a risk of loss in trading stocks and stocks options and you should carefully consider your financial position before making any trades.  The reference to statistical probabilities does not pertain to profitability, but rather to the direction of the market. The size and the duration of the markets move, as well as entry and exit prices ultimately determines success or failure in a trade and is in no way represented in these statistics. Furthermore,  no representation is being made that any of the examples shown resulted in actual trades. This is not, nor is it intended to be, a complete study of chart patterns or technical analysis and should not be deemed as such.
Stock trading involves high risks and you can lose a significant amount of money.
金币:
奖励:
热心:
注册时间:
2006-7-3

回复 使用道具 举报

 楼主| 发表于 2009-4-3 07:25 | 显示全部楼层
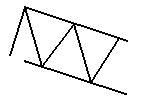
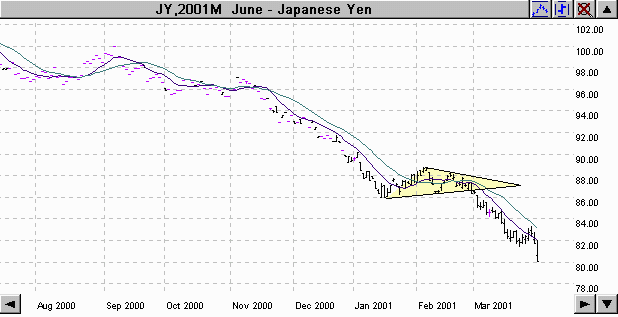
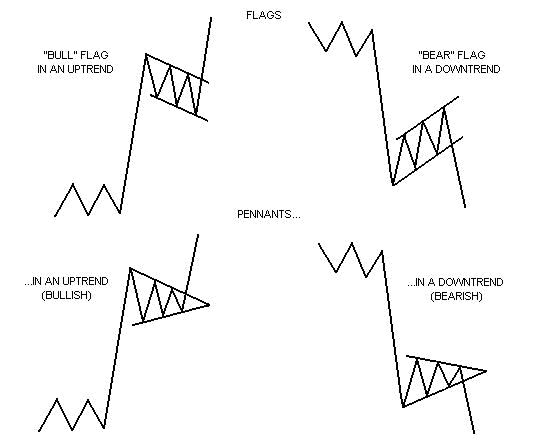
Flags and pennants can be categorized as continuation patterns.  They usually represent only brief pauses in a dynamic market.  They are typically seen right after a big, quick move.  The market then usually takes off again in the same direction.  Research has shown that these patterns are some of the most reliable continuation patterns. Bullish flags are characterized by lower tops and lower bottoms, with the pattern slanting against the trend. But unlike wedges, their trendlines run parallel. Bearish flags are comprised of higher tops and higher bottoms.  "Bear" flags also have a tendency to slope against the trend.  Their trendlines run parallel as well. Pennants look very much like symmetrical triangles.  But pennants are typically smaller in size (volatility) and duration.   (Volume generally contracts during the pause with an increase on the breakout.)  (Chart examples of flag and pennant patterns using commodity charts.)  (Stock charts.)  Futures and options trading carries significant risk and you can lose some, all or even more than your investment. Stock trading involves high risks and you can lose a significant amount of money. The information contained here was gathered from sources deemed reliable, however, no claim is made as to its accuracy or content. This does not contain specific recommendations to buy or sell at particular prices or times, nor should any of the examples presented be deemed as such. There is a risk of loss in trading futures and futures options and stocks and stocks options and you should carefully consider your financial position before making any trades.  The reference to statistical probabilities does not pertain to profitability, but rather to the direction of the market. The size and the duration of the markets move, as well as entry and exit prices ultimately determines success or failure in a trade and is in no way represented in these statistics.  This is not, nor is it intended to be, a complete study of chart patterns or technical analysis and should not be deemed as such.


CHART EXAMPLES OF FLAG AND PENNANT PATTERNS / COMMODITIES "BULL" FLAG IN AN UPTREND (BULLISH) 
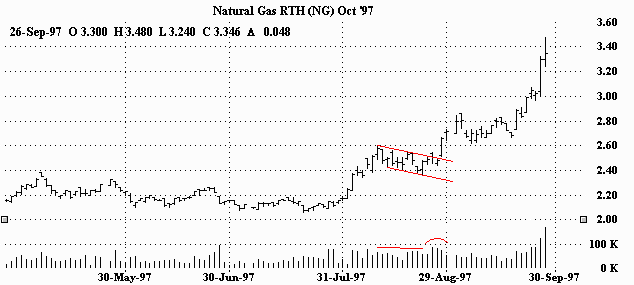
After a sharp rally, this "bull" flag served as a breather before running off again in the same direction. You can see the volume ease up a bit in the beginning of the flag, but then pick up as it nears the top of the formation and blows through it. "BULL" FLAG IN AN UPTREND (BULLISH) 
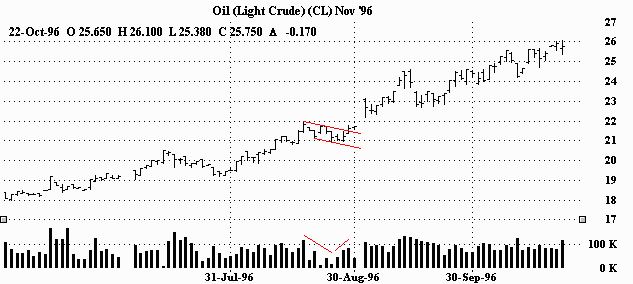
"Bull" flag in an uptrend.  Quick rally, short pause, blast higher.  Volume dips in the flag and surges on the breakout.  "BEAR" FLAG IN A DOWNTREND (BEARISH) 
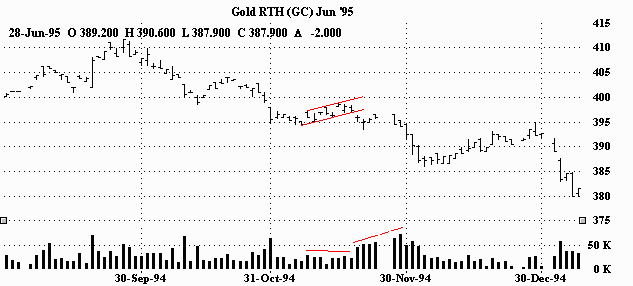
"Bear" flag in a downtrend.  After a big rout, the flag seemingly presents a chance to re-group before continuing in the same direction (down.)  Volume diminishes during the pause and then rapidly expands on the continuation.  "BEAR" FLAG IN THE BEGINNING OF A DOWNTREND (BEARISH) 
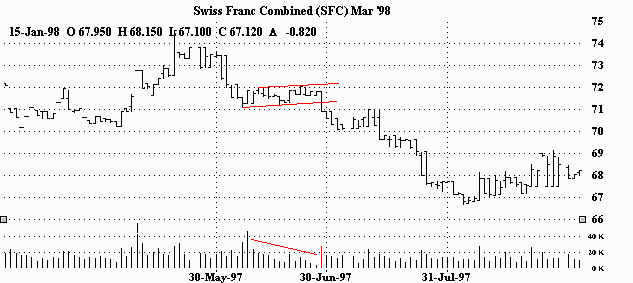
After a big dump, this "bear" flag sets the stage for another quick and even larger fall.  Volume decreases considerably in the flag, but the break to the downside is accompanied by a big increase in activity. "BULL" PENNANT IN AN UPTREND (BULLISH) 
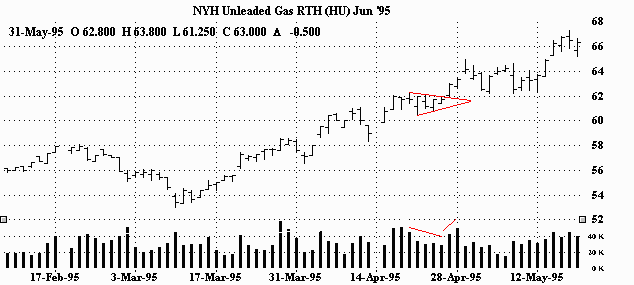
"Bull" pennant in an uptrend.  After a month long rally, the market takes a five day breather and continues even higher.  Volume dips briefly and then picks up on the breakout.  "BULL" PENNANT IN AN UPTREND (BULLISH) 
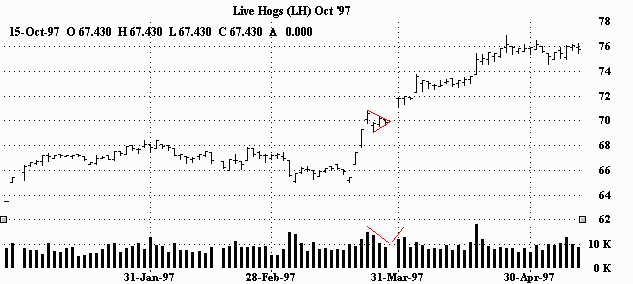
How's that for a pattern?  Remember from the preceding page; 'pennants look very much like symmetrical triangles, but are typically smaller in size (volatility) and duration.'  After a near straight up advance, the market takes only three days before resuming the upmove.  During those few days, participation drops off a bit, but comes back as the market explodes out of the pennant.  (Take a look at all those gaps right before and right after the pennant.  Obviously a very strong and convinced market!) "BEAR" PENNANT IN A DOWNTREND (BEARISH) 
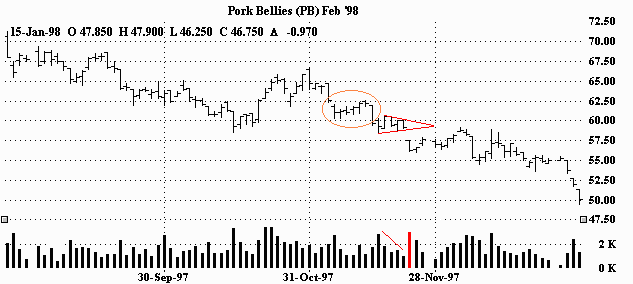
"Bear" pennant in a downtrend.  This pattern came right after a 'bear' flag breakout.  (Can you see it?) This pennant also presents only a brief pause before the market reasserts itself in the direction of the trend (down.)  Volume dips in the pattern and jumps as the market breaks out and gaps lower.    "BEAR" PENNANT IN THE BEGINNING OF A DOWNTREND (BEARISH) 
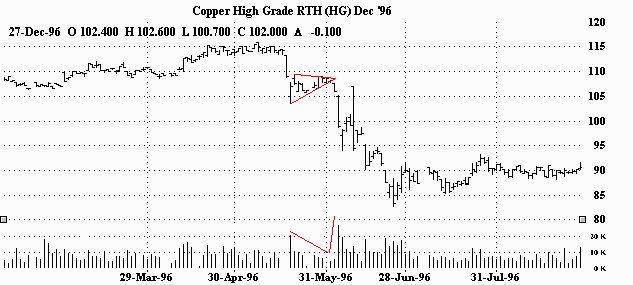
"Bear" pennant in the beginning of a downtrend.  After a dramatic two day plunge, the market has a short lived consolidation. The rout continues and the market collapses.  You can see activity dry up in the pennant.  The breakout though, was made on extremely heavy volume.    The information contained here was gathered from sources deemed reliable, however, no claim is made as to its accuracy or content. This does not contain specific recommendations to buy or sell at particular prices or times, nor should any of the examples presented be deemed as such. There is a risk of loss in trading futures and futures options and you should carefully consider your financial position before making any trades.  The reference to statistical probabilities does not pertain to profitability, but rather to the direction of the market. The size and the duration of the markets move, as well as entry and exit prices ultimately determines success or failure in a trade and is in no way represented in these statistics. Furthermore,  no representation is being made that any of the examples shown resulted in actual trades. This is not, nor is it intended to be, a complete study of chart patterns or technical analysis and should not be deemed as such.  
Futures and options trading carries significant risk and you can lose some, all or even more than your investment.


CHART EXAMPLES OF FLAG AND PENNANT PATTERNS / STOCKS
"BULL" FLAG IN AN UPTREND (BULLISH)
AMHC / American Healthways, Inc.

Bull flag in an uptrend. Big move with big volume. Notice how the breakout move was approximately as large as the flag's 'pole'.
The information contained here was gathered from sources deemed reliable, however, no claim is made as to its accuracy or content. This does not contain specific recommendations to buy or sell at particular prices or times, nor should any of the examples presented be deemed as such. There is a risk of loss in trading stocks and stocks options and you should carefully consider your financial position before making any trades.  The reference to statistical probabilities does not pertain to profitability, but rather to the direction of the market. The size and the duration of the markets move, as well as entry and exit prices ultimately determines success or failure in a trade and is in no way represented in these statistics. Furthermore,  no representation is being made that any of the examples shown resulted in actual trades. This is not, nor is it intended to be, a complete study of chart patterns or technical analysis and should not be deemed as such.
Stock trading involves high risks and you can lose a significant amount of money.
金币:
奖励:
热心:
注册时间:
2006-7-3

回复 使用道具 举报

 楼主| 发表于 2009-4-3 07:26 | 显示全部楼层
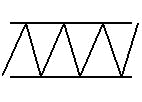
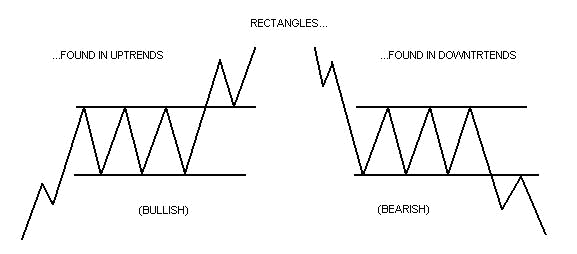
Rectangles should generally be traded as continuation patterns.  They are indecision areas that are usually resolved in the direction of the trend.  Research has shown that this is true far more often than not. Of course, the trendlines run parallel in a rectangle. Supply and demand seems evenly balanced at the moment.  Buyers and sellers also seem equally matched.  The same 'highs' are constantly tested as are the same 'lows'. The market vacillates between two clearly set parameters.  (While volume doesn't seem to suffer like it does in other patterns, there usually is a lessening of activity within the pattern.  But like the others, volume should noticeably increase on the breakout.) (Chart examples of rectangle patterns using commodity charts.)  (Stock charts.) Futures and options trading carries significant risk and you can lose some, all or even more than your investment. Stock trading involves high risks and you can lose a significant amount of money. The information contained here was gathered from sources deemed reliable, however, no claim is made as to its accuracy or content. This does not contain specific recommendations to buy or sell at particular prices or times, nor should any of the examples presented be deemed as such. There is a risk of loss in trading futures and futures options and stocks and stocks options and you should carefully consider your financial position before making any trades.  The reference to statistical probabilities does not pertain to profitability, but rather to the direction of the market. The size and the duration of the markets move, as well as entry and exit prices ultimately determines success or failure in a trade and is in no way represented in these statistics.  This is not, nor is it intended to be, a complete study of chart patterns or technical analysis and should not be deemed as such.


CHART EXAMPLES OF RECTANGLE PATTERNS RECTANGLE IN AN UPTREND (BULLISH) 
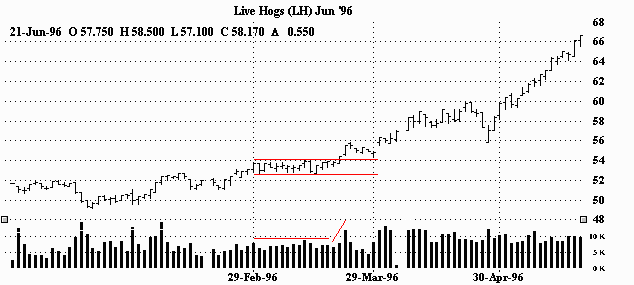
Rectangle pattern in an uptrend.  The market goes into roughly a three week consolidation before it finds its resolve and pushes higher.  There is a general lessening and sort of balance to volume during the formation, but there is a clear increase on the breakout.  (It's interesting to note that the volume seems erratic prior to the consolidation, kind of balanced during, and while still generally balanced as the market moves away from the rectangle, noticeably heavier.) RECTANGLE IN THE BEGINNING AN UPTREND (BULLISH) 
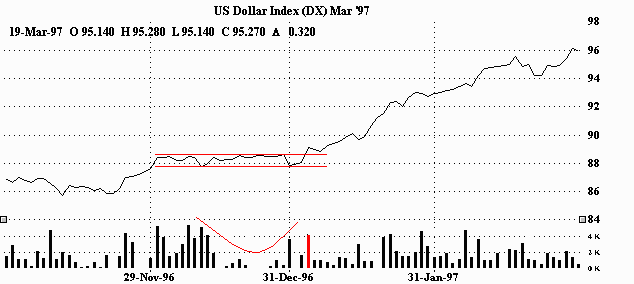
This rectangle in the beginning of an uptrend kept the market guessing for a month before resuming what it had started (uptrend.)  This lengthy indecision saw volume dive.  But the breakout seemed to wake everybody up.  As you can see it was made on heavy volume.  (By the way, a line chart was used in this example for easier viewing.) RECTANGLE IN AN UPTREND (BULLISH)    
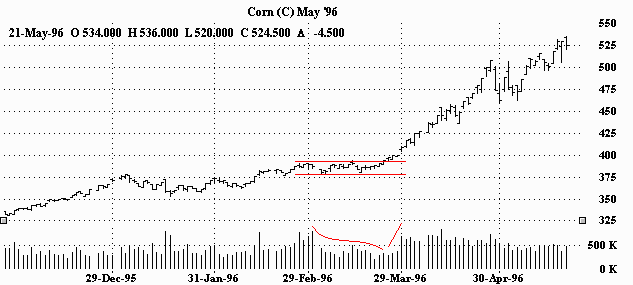
Another month long rectangle in an uptrend.  But, there's no looking back once the market resolves itself. Volume decreases during the wait.  You can see that somewhere in the middle of the rectangle, there is an attempted breakout. The market pokes through the top 'parameter' only to be turned back, closing lower than it opened.  You can also see the short lived spike in volume as well.  However, when the market fails to violate the bottom 'parameter', the market charges back up.  And even before the ultimate upside breakout, volume starts expanding on the trek higher.  The breakout finally happens and is accomplished on strong volume.      RECTANGLE IN A DOWNTREND (BEARISH) 
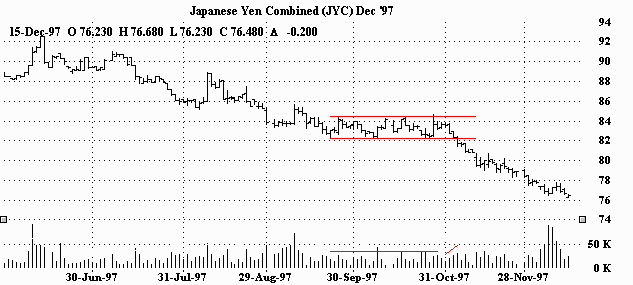
Here we have a rectangle in a downtrend.  This one lasted for about six weeks.  After a pretty big fall, the market consolidated before determining where to go next.  Obviously, they figured it out, and headed off in the direction they started in (down.) Volume kind of thins out during this sideways period and then picks up as it heads for the bottom of the rectangle one last time and breaks through it.  Notice that just prior to the downside resolution there was an attempted (failed) breakout to the upside. The markets inability to follow through was quickly exploited by the 'bears', as the market collapsed only a handful of days later. RECTANGLE IN A DOWNTREND (BEARISH) 
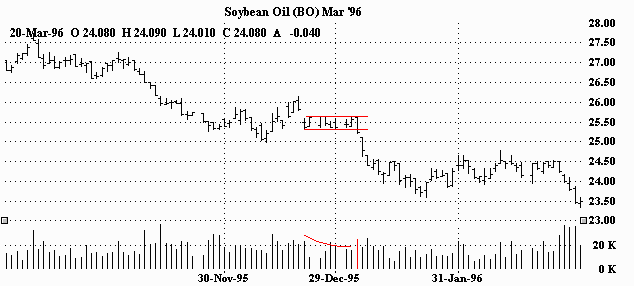
Rectangle in a downtrend.  The market gets rocked, and bounces a bit, before settling into a two week sideways pattern. The market then resolves itself and blows through the bottom of the rectangle.  Volume can best be described as a bit lighter but erratic during the pattern.  However, volume is clearly heavier on the break lower.   RECTANGLE(S)  IN A DOWNTREND (BEARISH)
Weekly Continuation (or Splice) Chart Now here's an interesting one.  First, it should be noted that this is a weekly chart.  Price and volume encompass a full weeks worth of activity.  Second, you can make a case that we actually have two rectangles.  And each rectangle is quite lengthy. The first one, while not perfect in structure, still has an unmistakable rectangular appearance with easily recognizable 'parameters'. After the first breakout, the market falls into another prolonged  trading range (over a year.) This one also has a clear rectangular (sideways) appearance (and is also better in structure.)  Volume is a bit more ambiguous. There aren't any startling changes in the volume readings, but there does appear to be more activity on the move out of the rectangles than inside of them.  And as for the second pattern, volume appears to pick up on the last attempt at the bottom 'parameter', seemingly setting the stage for the break. Lastly, notice that the market was unable to reach the top 'parameter' on its last rally. That more than likely was the encouragement the 'bears' needed to press the market.  The information contained here was gathered from sources deemed reliable, however, no claim is made as to its accuracy or content. This does not contain specific recommendations to buy or sell at particular prices or times, nor should any of the examples presented be deemed as such. There is a risk of loss in trading futures and futures options and you should carefully consider your financial position before making any trades.  The reference to statistical probabilities does not pertain to profitability, but rather to the direction of the market. The size and the duration of the markets move, as well as entry and exit prices ultimately determines success or failure in a trade and is in no way represented in these statistics.  This is not, nor is it intended to be, a complete study of chart patterns or technical analysis and should not be deemed as such.  
Futures and options trading carries significant risk and you can lose some, all or even more than your investment.


CHART EXAMPLES OF RECTANGLE PATTERNS
STOCKS

RECTANGLE IN AN UPTREND (BULLISH)
ESI / ITT Educational Services
Rectangle in an uptrend (bullish). From PRS, Vol. 3, No. 1, for the week of 1/6/03. Measure the base, add it to the breakout point and determine your measured price target. (Look at the huge volume on its breakout day.)

RECTANGLE IN A DOWNTREND (BEARISH)
GLK / Great Lakes Chemical Corp.
Rectangle in a downtrend (bearish). Notice how the how the volume increases on its breakout and continues to rise as the price falls (bearish confirmation). (More on volume.) From PRS, Vol. 3, No. 3, for the week of 1/20/03.
The information contained here was gathered from sources deemed reliable, however, no claim is made as to its accuracy or content. This does not contain specific recommendations to buy or sell at particular prices or times, nor should any of the examples presented be deemed as such. There is a risk of loss in trading stocks and stocks options and you should carefully consider your financial position before making any trades.  The reference to statistical probabilities does not pertain to profitability, but rather to the direction of the market. The size and the duration of the markets move, as well as entry and exit prices ultimately determines success or failure in a trade and is in no way represented in these statistics. Furthermore,  no representation is being made that any of the examples shown resulted in actual trades. This is not, nor is it intended to be, a complete study of chart patterns or technical analysis and should not be deemed as such.
Stock trading involves high risks and you can lose a significant amount of money.
金币:
奖励:
热心:
注册时间:
2006-7-3

回复 使用道具 举报

 楼主| 发表于 2009-4-3 07:28 | 显示全部楼层
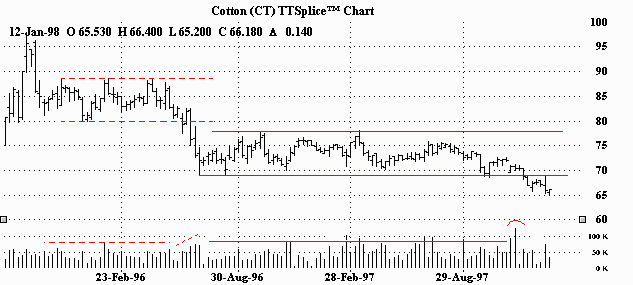
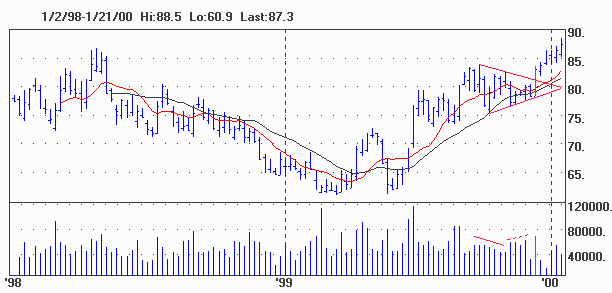
The head and shoulders pattern is generally regarded as a reversal pattern and it is most often seen in uptrends. It is also most reliable when found in an uptrend as well. Eventually, the market begins to slow down and the forces of supply and demand are generally considered in balance.  Sellers come in at the highs (left shoulder) and the downside is probed (beginning neckline.)  Buyers soon return to the market and ultimately push through to new highs (head.) However, the new highs are quickly turned back and the downside is tested again (continuing neckline.)  Tentative buying re-emerges and the market rallies once more, but fails to take out the previous high. (This last top is considered the right shoulder.)  Buying dries up and the market tests the downside yet again. Your trendline for this pattern should be drawn from the beginning neckline to the continuing neckline.  (Volume has a greater importance in the head and shoulders pattern in comparison to other patterns.  Volume generally follows the price higher on the left shoulder. However, the head is formed on diminished volume indicating the buyers aren't as aggressive as they once were.  And on the last rallying attempt-the left shoulder-volume is even lighter than on the head, signaling that the buyers may have exhausted themselves.)  New selling comes in and previous buyers get out.  The pattern is complete when the market breaks the neckline.  (Volume should increase on the breakout.) (Chart examples of  head and shoulders patterns using commodity charts.)  (Stock charts.) 
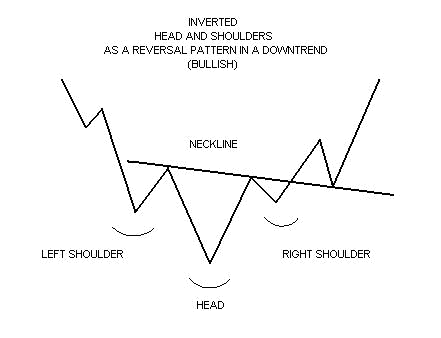
The head and shoulders pattern can sometimes be inverted.  The inverted head and shoulders is typically seen in downtrends.  (What's noteworthy about the inverted head and shoulders is the volume aspect.  The inverted left shoulder should be accompanied by an increase in volume.  The inverted head should be made on lighter volume. The rally from the head however, should show greater volume than the rally from the left shoulder. Ultimately, the inverted right shoulder should register the lightest volume of all.  When the market then rallies through the neckline, a big increase in volume should be seen.)  (Chart examples of inverted head and shoulders patterns using commodity charts.)  (Stock charts.) Futures and options trading carries significant risk and you can lose some, all or even more than your investment. Stock trading involves high risks and you can lose a significant amount of money. The information contained here was gathered from sources deemed reliable, however, no claim is made as to its accuracy or content. This does not contain specific recommendations to buy or sell at particular prices or times, nor should any of the examples presented be deemed as such. There is a risk of loss in trading futures and futures options and stocks and stocks options and you should carefully consider your financial position before making any trades.  The reference to statistical probabilities does not pertain to profitability, but rather to the direction of the market. The size and the duration of the markets move, as well as entry and exit prices ultimately determines success or failure in a trade and is in no way represented in these statistics.  This is not, nor is it intended to be, a complete study of chart patterns or technical analysis and should not be deemed as such.


CHART EXAMPLES OF HEAD AND SHOULDERS
PATTERNS / COMMODITIES

HEAD AND SHOULDERS IN AN UPTREND (BEARISH)
Coffee / July 2002
Classic head and shoulders reversal pattern in an uptrend (bearish). Measure the size of the base (purple line) and subtract that (green line) from the breakout point of the neckline for your measured target (green dotted line).

HEAD AND SHOULDERS AS A REVERSAL PATTERN IN AN UPTREND (BEARISH) The head and shoulders signaled a market top.  You can see that the volume diminished with each market top during the formation of the head and shoulders pattern, but then picked up on the breakout and continued to expand on the sell-off.

HEAD AND SHOULDERS AS A REVERSAL PATTERN IN A MINOR UPTREND (BEARISH)          
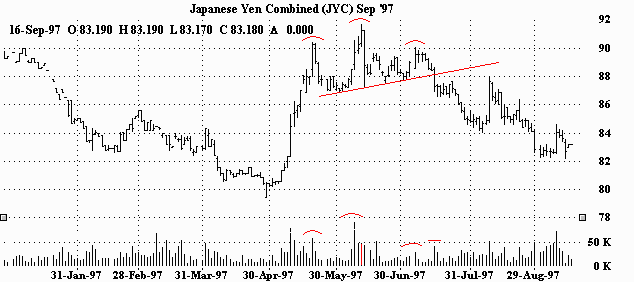
The head and shoulders signaled a top to this rally.  (The Japanese Yen had been in a downtrend for more than three years prior to this relatively short lived upmove.)  As you can see, the head and shoulders pattern is easily recognizable on the price chart.  While the volume chart is'nt as clear, closer scrutiny will reveal that indeed each topping day in the pattern was made on diminishing volume.  The big jump in activity just prior to completing the 'head', was done on short covering, (shorts getting out of their positions rather than new longs coming in.)  However, the familiar spike in volume is evident on the breaking of the neckline.       HEAD AND SHOULDERS AS A REVERSAL PATTERN IN A MINOR UPTREND (BEARISH) 
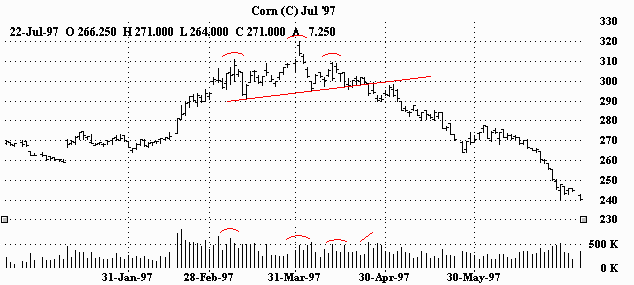
This head and shoulders pattern signaled an end to corn's advance.  (Prior to this bounce, it had been in a downtrend for about six months.)  You can see the volume diminish as the market eventually loses steam, followed by the typical burst of activity with the breaking of the neckline.                                                                                                                                                                                      HEAD AND SHOULDERS AS A REVERSAL PATTERN IN AN UPTREND (BEARISH) This head and shoulders pattern reversed a nearly year long uptrend.  (You'll notice that in this example the neckline is sloping on a slight downward angle.)  Nevertheless, as with the other examples, as the pattern unfolded, the volume weakened with each topping action.  In fact, volume actually started to pick up on the initial dump after the head was formed (another bearish sign).  And of course, there was the big increase in volume on the breaking of the neckline.  (The market actually gapped below it!)

HEAD AND SHOULDERS AS A REVERSAL PATTERN IN AN UPTREND (BEARISH) 
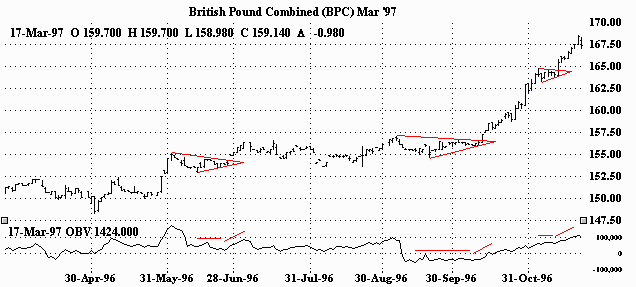
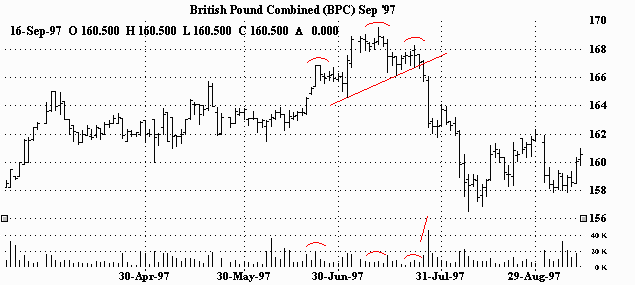
The head and shoulders pattern foreshadowed the end to the British Pound's run.  Volume dried up on the last few advances and prices ultimately collapsed.  The dramatic plunge through the neckline was accompanied by a huge increase in volume. The information contained here was gathered from sources deemed reliable, however, no claim is made as to its accuracy or content. This does not contain specific recommendations to buy or sell at particular prices or times, nor should any of the examples presented be deemed as such. There is a risk of loss in trading futures and futures options and you should carefully consider your financial position before making any trades.  The reference to statistical probabilities does not pertain to profitability, but rather to the direction of the market. The size and the duration of the markets move, as well as entry and exit prices ultimately determines success or failure in a trade and is in no way represented in these statistics. Furthermore, no representation is being made that any of the examples shown resulted in actual trades. This is not, nor is it intended to be, a complete study of chart patterns or technical analysis and should not be deemed as such.  
Futures and options trading carries significant risk and you can lose some, all or even more than your investment.


CHART EXAMPLES OF HEAD AND SHOULDERS PATTERNS / STOCKS

HEAD AND SHOULDERS AS A REVERSAL PATTERN IN AN UPTREND (BEARISH)
DP / Diagnostic Products Corp.
Before
After
'Before' shot / Head and Shoulders Pattern spotted on 11/9/01
'After' shot / Head and Shoulders Pattern breakout on 9/13/01, low on 9/15/01
In this example I show a 'before' view and the subsequent 'after' view. I have found the head and shoulders pattern to be one of the most reliable patterns to trade.
What's interesting is that this pattern was spotted on 11/9/01 ('before' chart), two days before the dramatic sell-off. It was published and sent to subscribers in chartpatterns.com's Pattern Recognition Services Weekly Newsletter. To get alerted to high probability patterns like these and others you see on this site, simply subscribe to the Pattern Recognition Services Newsletter and have approximately 20-25 patterns sent to you every Sunday so you'll know what's hot and what's not for the coming week.

HEAD AND SHOULDERS AS A REVERSAL PATTERN IN AN UPTREND (BEARISH)
IBM / Int'l. Business Machines
Head and Shoulders in an uptrend (bearish). This one had sell written all over it. Notice the dissipating volume on the "tops". The first close beneath the neckline was followed by a dramatic sell-off. And check out the big spike in activity on the collapse. The basing (rising wedge in a new downtrend) after the dump was nothing more than a breather before the next crash lower. And the signature volume spike on the downside breakout was evident as usual.
The information contained here was gathered from sources deemed reliable, however, no claim is made as to its accuracy or content. This does not contain specific recommendations to buy or sell at particular prices or times, nor should any of the examples presented be deemed as such. There is a risk of loss in trading stocks and stocks options and you should carefully consider your financial position before making any trades.  The reference to statistical probabilities does not pertain to profitability, but rather to the direction of the market. The size and the duration of the markets move, as well as entry and exit prices ultimately determines success or failure in a trade and is in no way represented in these statistics. Furthermore,  no representation is being made that any of the examples shown resulted in actual trades. This is not, nor is it intended to be, a complete study of chart patterns or technical analysis and should not be deemed as such.
Stock trading involves high risks and you can lose a significant amount of money.


CHART EXAMPLES OF INVERTED HEAD AND SHOULDERS PATTERNS

INVERTED HEAD AND SHOULDERS AS A REVERSAL PATTERN IN A DOWNTREND (BULLISH)
The inverted head and shoulders signaled a bottom.  While the left shoulder actually dipped a bit lower than the head, everything else appears to be 'text-book' in its formation.  Diminished volume on the bottoms and an increase in volume on the breaking of the neckline.  (In fact, you'll notice that the market gapped above it!)

INVERTED HEAD AND SHOULDERS AS A REVERSAL PATTERN IN DOWNTREND (BULLISH)
Can you see the inverted head and shoulders in the downtrend. A clear bullish foreshadowing as to what was to come. Notice how the market breaks out through the neckline (it actually gaps above it), ... comes back to re-test it and then powers back up.

INVERTED HEAD AND SHOULDERS AS A REVERSAL PATTERN IN A MINOR DOWNTREND (BULLISH)
This inverted head and shoulders pattern reversed a minor downturn.  And while the right shoulder's decline exceeded the left shoulder's, the pattern effectively ended the downtrend.  Volume declined on the bottoms and picked up on the breaking of the neckline.  (Note the gap on the breakout!)  (This market ultimately climbed to over 67 cents by the end of March.)

INVERTED HEAD AND SHOULDERS AS A REVERSAL PATTERN IN A MINOR DOWNTREND (BULLISH)
How's that for a reversal?!  This relatively small inverted head and shoulders pattern marked the end to heating oil's minor downtrend and the beginning to a powerful rally.  As in the unleaded gasoline chart, the right shoulder dips a bit further than the left, but also gaps through the neckline!  Volume acts accordingly with a lessening of activity on each bottom and a burst of activity on the breakout.

INVERTED HEAD AND SHOULDERS AS A REVERSAL PATTERN IN A DOWNTREND (BULLISH)

Monthly Continuation (or Splice) Chart
The inverted head and shoulders reversed a lengthy downtrend.  As you can see, it also took about two years to complete the pattern.  But given the size and the duration of the ensuing bull run, it looks like it was worth the wait.  Keep in mind that on this example, we're using a monthly chart. Each bar represents a months worth of price and volume. Upon closer examination, you can see that the volume lightens up on the bottoms.  However, the jump in volume on the breaking of the neckline and especially on the continuing upmove is clearly visible.

INVERTED HEAD AND SHOULDERS AS A REVERSAL PATTERN IN A MINOR DOWNTREND (BULLISH)
The inverted head and shoulders reversed this minor downtrend.  The price traced out a classic pattern. While it's true there was a bit more activity on the right shoulder than the head, volume still showed a tendency to lighten on the bottoms with a pick-up on the breaking of the neckline.  You can also see the volume increase as the market continues its trek higher.
The information contained here was gathered from sources deemed reliable, however, no claim is made as to its accuracy or content. This does not contain specific recommendations to buy or sell at particular prices or times, nor should any of the examples presented be deemed as such. There is a risk of loss in trading futures and futures options and you should carefully consider your financial position before making any trades.  The reference to statistical probabilities does not pertain to profitability, but rather to the direction of the market. The size and the duration of the markets move, as well as entry and exit prices ultimately determines success or failure in a trade and is in no way represented in these statistics. Furthermore,  no representation is being made that any of the examples shown resulted in actual trades. This is not, nor is it intended to be, a complete study of chart patterns or technical analysis and should not be deemed as such.
Futures and options trading carries significant risk and you can lose some, all or even more than your investment.
金币:
奖励:
热心:
注册时间:
2006-7-3

回复 使用道具 举报

 楼主| 发表于 2009-4-3 07:29 | 显示全部楼层


A trend can be defined as the direction in which the market is moving in.  When the supply of a commodity or stock is greater than the demand, the trend will be down as there are more sellers than buyers.  When the demand is greater than the supply, the trend will be up as there are more buyers than sellers.  (See volume.)  If the forces of supply and demand are nearly equal, the market will move sideways.  Eventually, when new information enters the market, it will begin to trend again, either up, down or perhaps sideways still, depending on how that information is viewed; positive (bullish), negative (bearish) or neutral (sideways.)  It's important to remember that money can be made or lost in bullish (uptrending), bearish (downtrending) and neutral (sideways - trending) markets. Trendlines help in determining what trend is in place. 
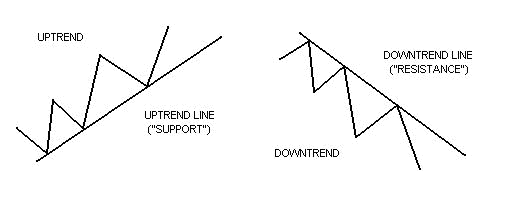
If a market is moving up, a line can be drawn connecting each successive higher bottom. This is an uptrend line or 'support'.  As long as the market remains on or above this line, the uptrend is intact.  If a market is moving down, a line can be drawn connecting each successive lower top.  This is a downtrend line or 'resistance'.  As long as prices remain on or below this line, the downtrend is intact. 
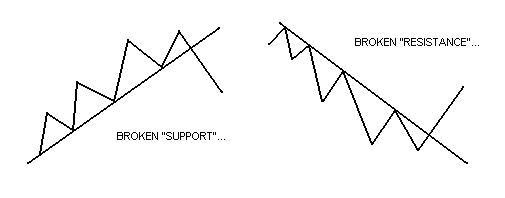
In general, once a trendline is broken, the trend which was previously in force is considered over, or at least in pause.  It should be noted that when an uptrend line or 'support' is broken, it then acts as 'resistance'. Likewise, if a downtrend line or 'resistance' is broken, it then becomes 'support'. 
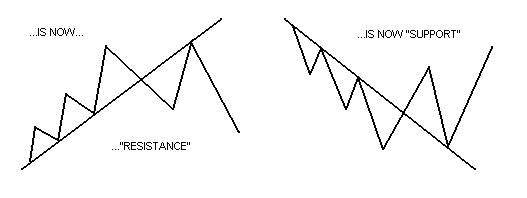
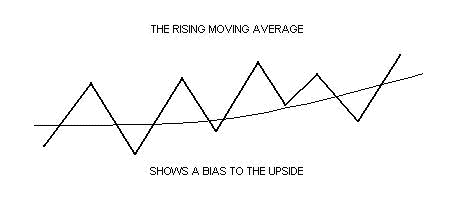
Moving averages are also very helpful in defining a trend.  Sometimes, when no clear trendline can be drawn, moving averages can clarify market bias by showing which direction the market has favored over a specific period of time.  A rising moving average is generally price friendly (bullish), while a declining moving average would be considered negative (bearish.)  A flat moving average would be viewed as neutral or (sideways-trending.) Futures and options trading carries significant risk and you can lose some, all or even more than your investment. Stock trading involves high risks and you can lose a significant amount of money. The information contained here was gathered from sources deemed reliable, however, no claim is made as to its accuracy or content. This does not contain specific recommendations to buy or sell at particular prices or times, nor should any of the examples presented be deemed as such. There is a risk of loss in trading futures and futures options and stocks and stocks options and you should carefully consider your financial position before making any trades.  The reference to statistical probabilities does not pertain to profitability, but rather to the direction of the market. The size and the duration of the markets move, as well as entry and exit prices ultimately determines success or failure in a trade and is in no way represented in these statistics.  This is not, nor is it intended to be, a complete study of chart patterns or technical analysis and should not be deemed as such.
Home  
金币:
奖励:
热心:
注册时间:
2006-7-3

回复 使用道具 举报

您需要登录后才可以回帖 登录 | 立即注册

本版积分规则

本站声明:MACD仅提供交流平台,请交流人员遵守法律法规。
值班电话:18209240771   微信:35550268

QQ|举报|意见反馈|手机版|MACD论坛

GMT+8, 2026-5-16 00:43 , Processed in 0.117370 second(s), 7 queries , MemCached On.

Powered by Discuz! X3.4

© 2001-2017 Comsenz Inc.

快速回复 返回顶部 返回列表