- 金币:
-
- 奖励:
-
- 热心:
-
- 注册时间:
- 2006-7-3
|
|

楼主 |
发表于 2009-4-12 08:44
|
显示全部楼层
Dec 21, 2008 1:27am
| |  Extensions Extensions
Quote:
Originally Posted by ivanhoe 
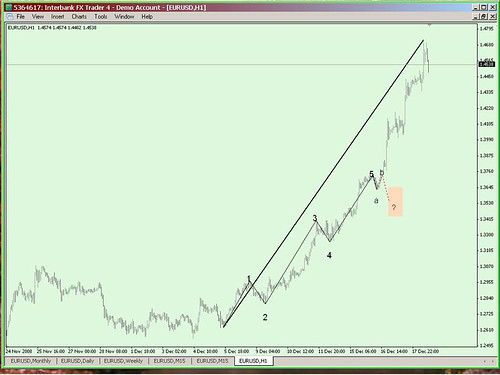
This is my first post to this site so if I’m in the wrong thread I apologize and please direct me to the newbies thread. I’m new to EW and am wondering what to make of my miscount shown in the chart. What would I call the continuation of the trend after the 5 wave?
Actually thought the count was looking good.
|
Hi Ivanhoe. Welcome. You are in the right thread.
May I suggest you should study the Elliot Wave Principle - Robert Prechter, or some other reliable source to get the basics down.
The short answer is impulse waves extend so one of either 1, 3, or 5 is at least 1.618 longer than the next longest. Generally, it is wave 3. A good clue is wave 3 extensions channel fairly well - with a slight parabolic incline toward vertical. 1st extensions do not channel well, they spread out like a fan getting larger; while 5th extensions tend to narrow like the Eiffel tower shape.
Extensions are a requirement in my book, subdivisions are optional, the three impulses cannot be about equal to each other, one needs to be longer. And 3 cannot be the shortest or shorter than 2.
The trick is to spot the overlap in the 1, 2 waves, with a smaller i, ii, iii, iv, v extension to complete 3, finished by a final 4, 5. Look to see if wave 3 is short and retraces below the top of wave 1 - an impulse rule.
After many attempts, you can spot extensions real time with good accuracy. Look for 9 wave (or 13) as the impulsive count. In other words, 5 peaks and 4 valleys. If it counts as 3, 7, 11... then it is corrective - likely zig-zags if you count 2, 4, 6 or 8 peaks.
AFTER a 5 wave impulse, you will get a corrective :3 pattern in simple or complex form. Euro/Usd completed a C wave at 1.47, and made a 5 wave move down in 1 or C to 1.38 (in my preferred count).
Blue Bottle posted this chart from Prechters online course a dozen posts ago.
__________________
- FXoffshore 
"Expect the best - prepare for the worst" Trade Charts and commentary: http://vault.bz
|
#1073
 Dec 21, 2008 8:41am Dec 21, 2008 8:41am
| |  e\u e\u
what do u think?
Attached Thumbnails 
Last edited by Barak's pip, Dec 21, 2008 9:26am
|
#1074
Dec 21, 2008 9:04am
| |
geppy 1hr count.
Attached Thumbnails
Last edited by pkimnyc, Dec 21, 2008 3:45pm
|
#1075
Dec 21, 2008 12:17pm
| |
Quote:
Originally Posted by Blue bottle
good charts hymns..
i guess u r new here, warm welcome to our EW thread..
Are you from Johor, Malaysia?
|
hello blue bottle,
yeah! new on ur thread  . just share my chart. . just share my chart.
__________________
http://elliot-wave-analysis.blogspot.com
|
#1076
Dec 21, 2008 3:11pm
| |
Quote:
Originally Posted by pkimnyc
guppy 1hr count.
|
Guppy is a ozzie trader with a MA technique named after him. That is geppy.
|
#1077
Dec 21, 2008 3:45pm
| |
Quote:
Originally Posted by SunTrader
Guppy is a ozzie trader with a MA technique named after him. That is geppy.
|
thanks for the correction. 
|
#1078
Dec 21, 2008 3:55pm
| |
dow weekly count. looks like we are screwed. 
Attached Thumbnails
|
|
|
|
 [复制链接]