- 金币:
-
- 奖励:
-
- 热心:
-
- 注册时间:
- 2006-7-3
|
|

楼主 |
发表于 2009-5-9 15:44
|
显示全部楼层
Wednesday, August 16, 2006What a Drag..........
Dear Readers,
I gotta level with ya, it is not fun to write this blog in this kind of environment. Another nearly triple-point rise today. Ugh. I notice the comments section has gone stark, raving mad - nearly 200 comments. If the market had been slammed today, I'd love to go check out the comments. As it is now, I'd rather not see what people are saying!
Well, as has been pointed out by readers before, there is no right or wrong in the market. There is simply the market. It seems hard to believe that less than a month ago (July 18th) we were flirting with breaking Dow 10,660 and heading into a major descent. Seems like a million years ago, doesn't it? Sad. My only hope is that my emotions tend to inversely correlate to the bearish prospects of the market. I'm feeling like crap, so maybe we're at a turning point, eh? Or maybe not.
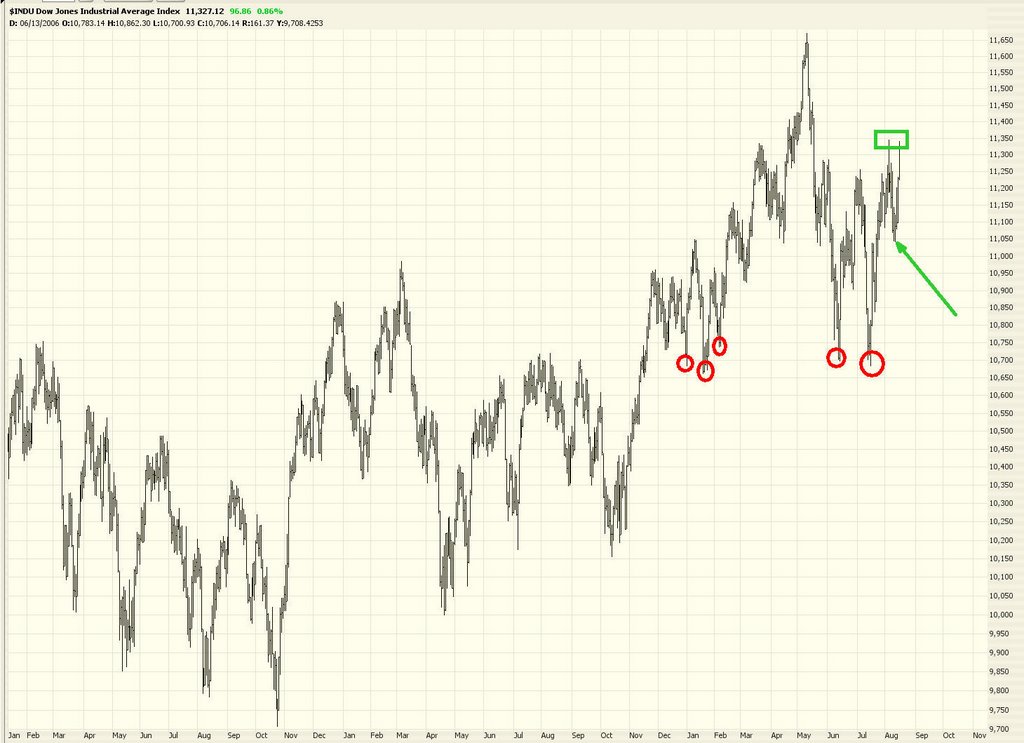
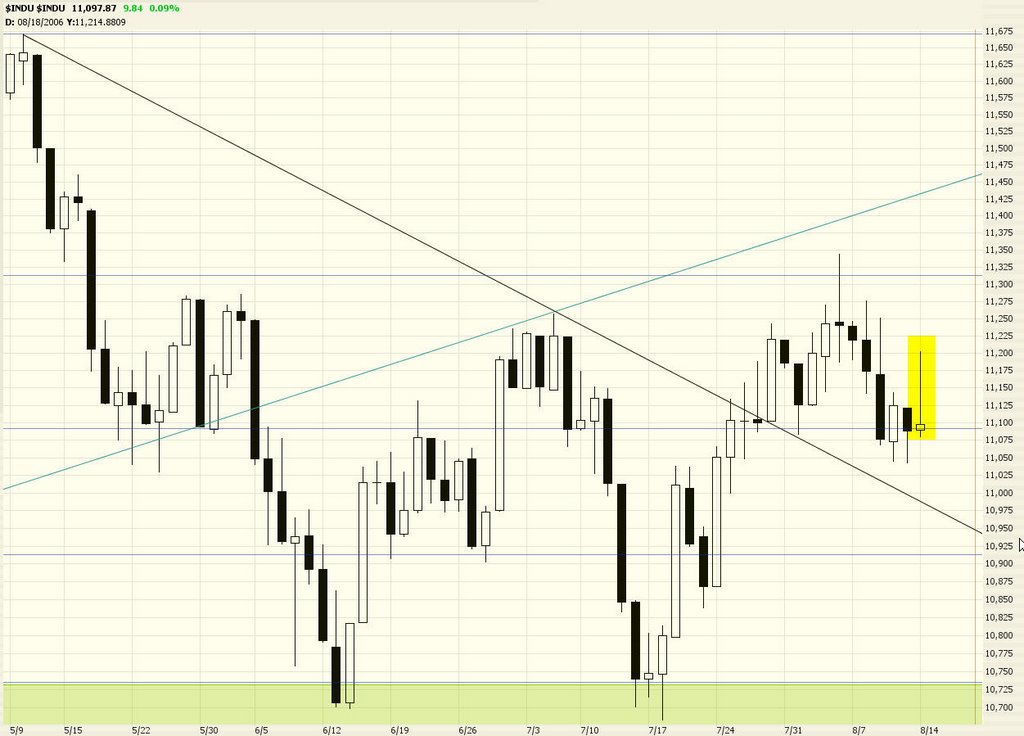
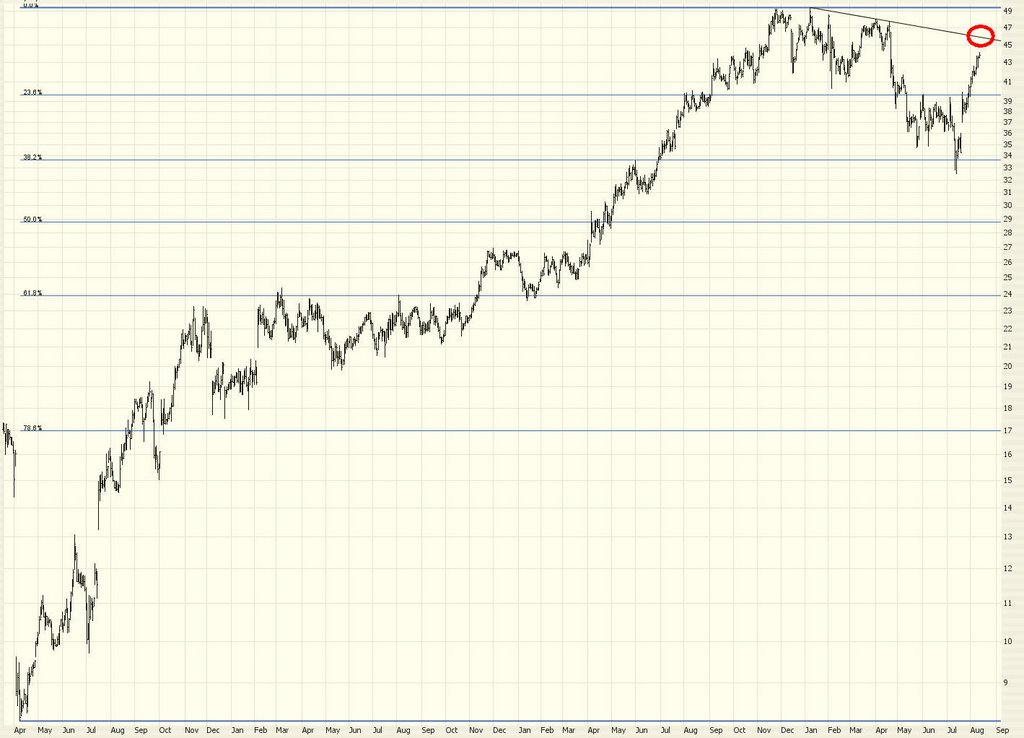
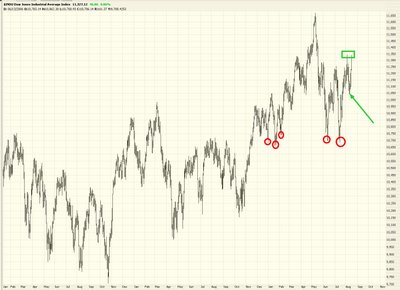
The $INDU has risen to the point where it's become very demoralizing for the bears. There's really no "line in the sand" left to speak of. If the high set today is crossed anytime soon, the only goal left to conquer is the high set back in May (and, if that is crossed, the all-time high set in January 2000). The Dow "should have" (definitely in quotes....) resumed its fall where the green arrow is pointed (remember, click any image to see a much bigger image). But the bulls grabbed this ball and ran with it.
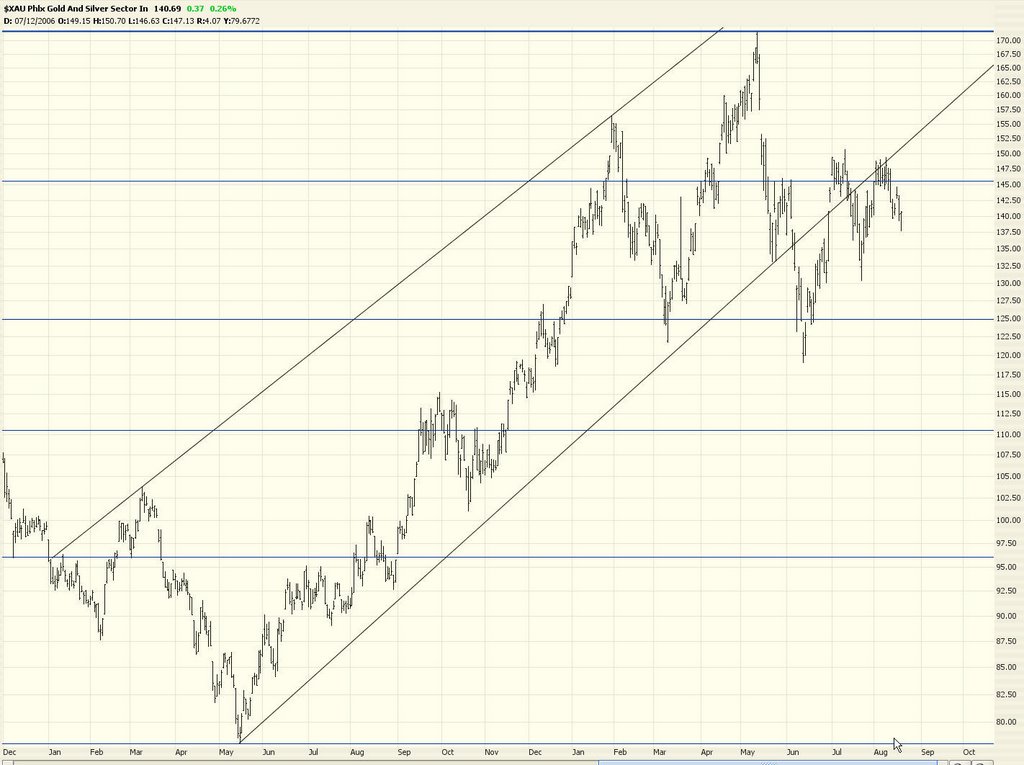
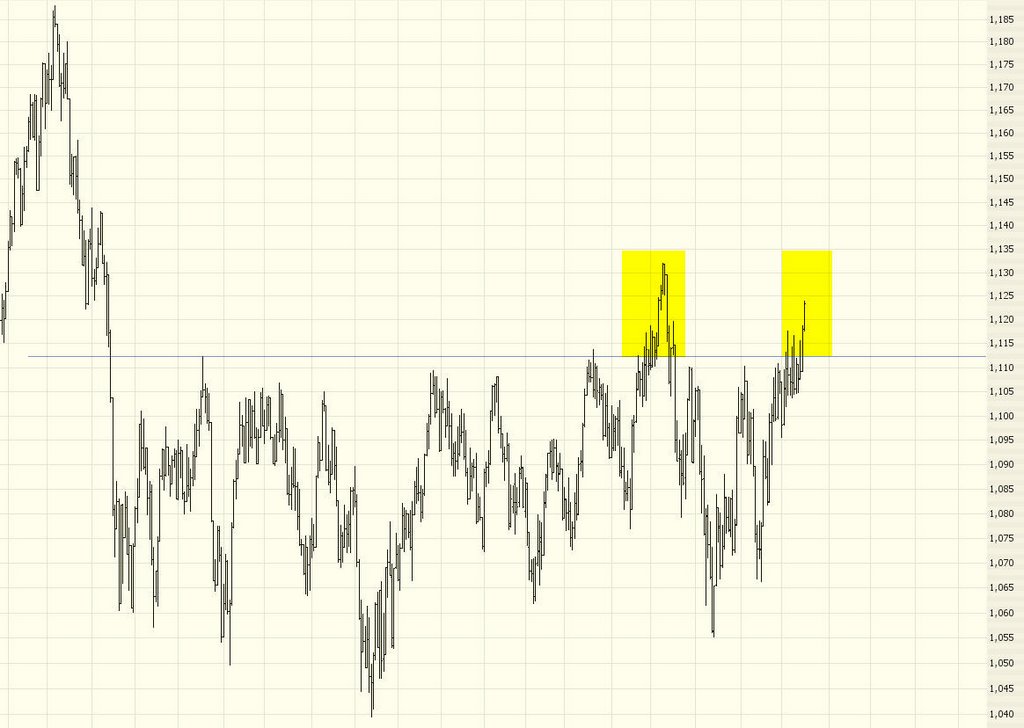
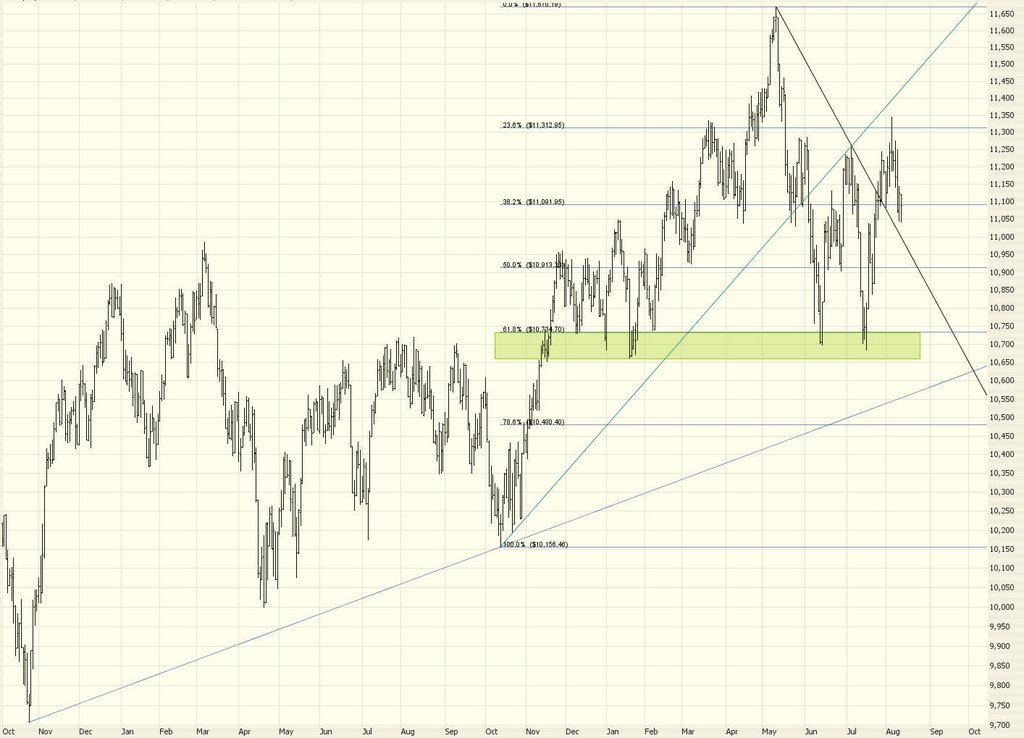
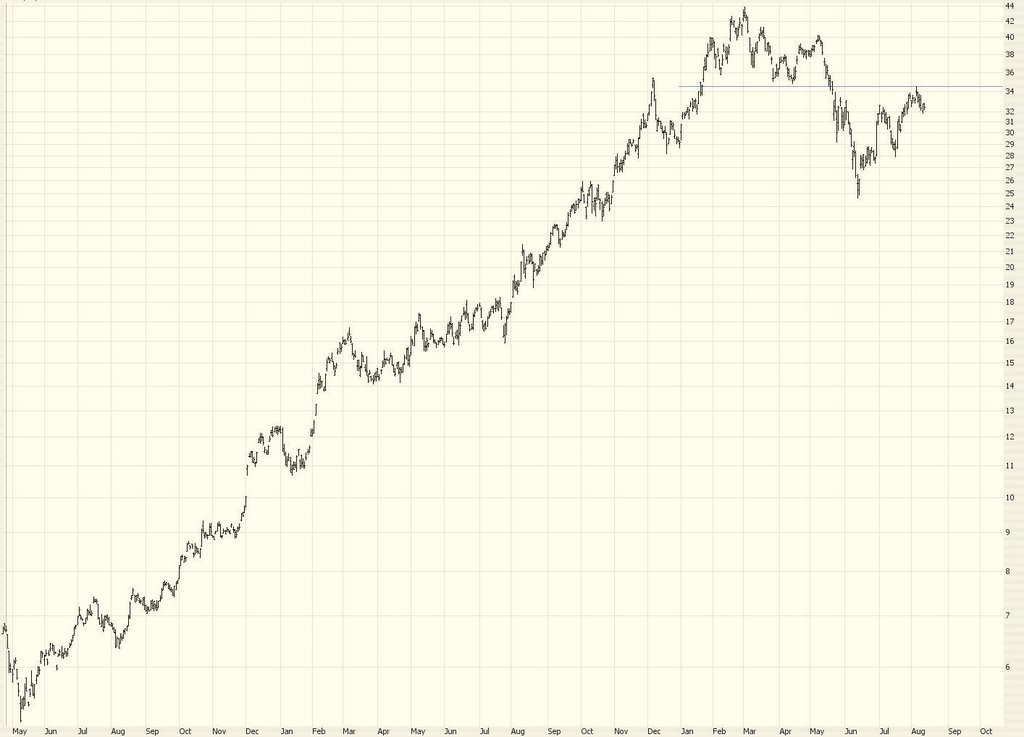
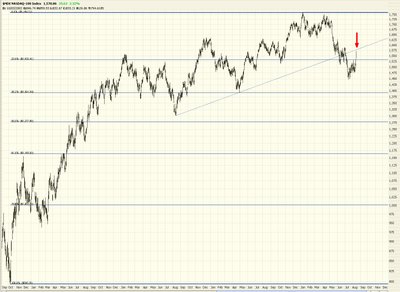
The NASDAQ 100, like many other indexes, is just underneath its former support line. There is a chance (hope springs eternal!) that this could be a turning point, since the former support is now resistance.
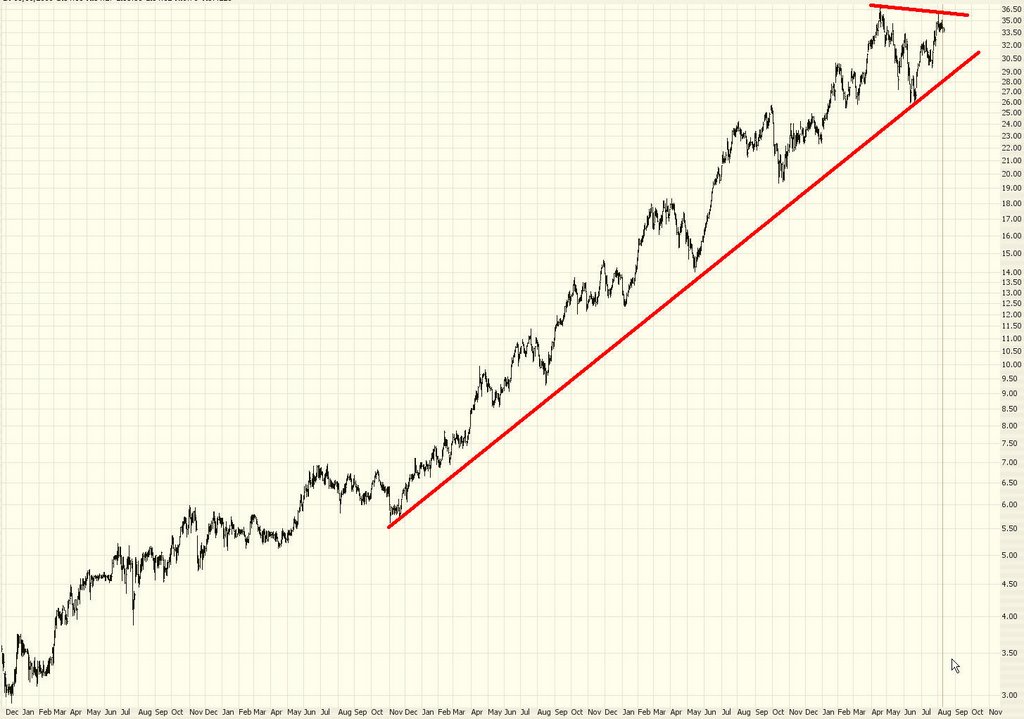
The S&P 100 is in a similar position.
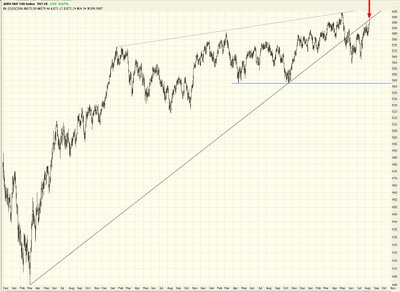
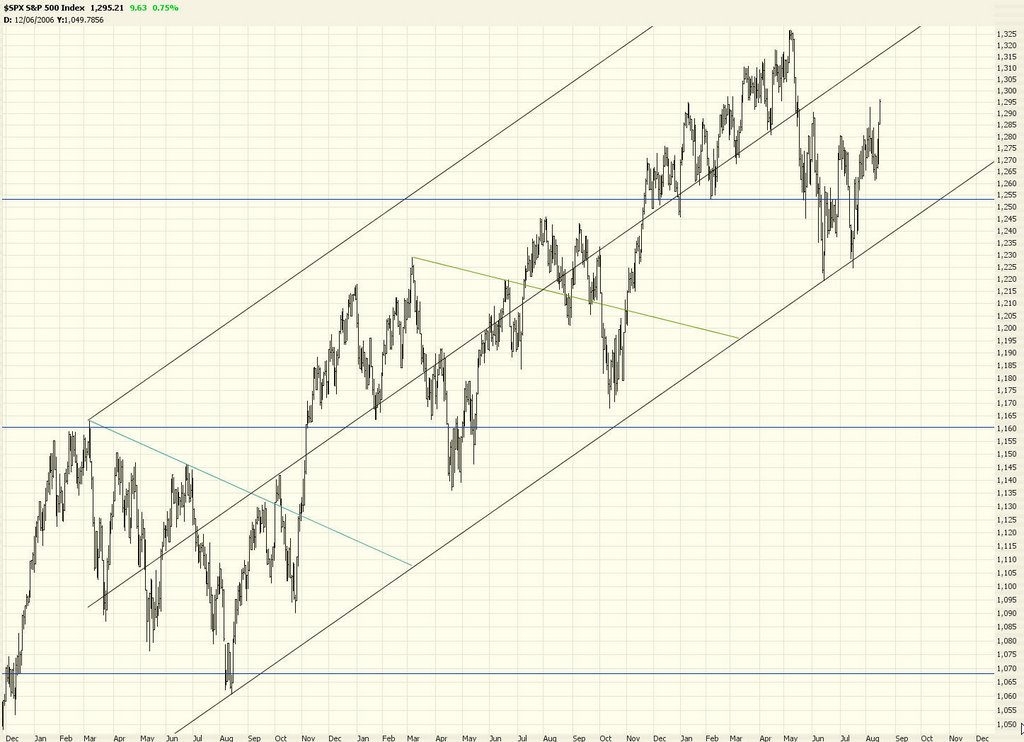
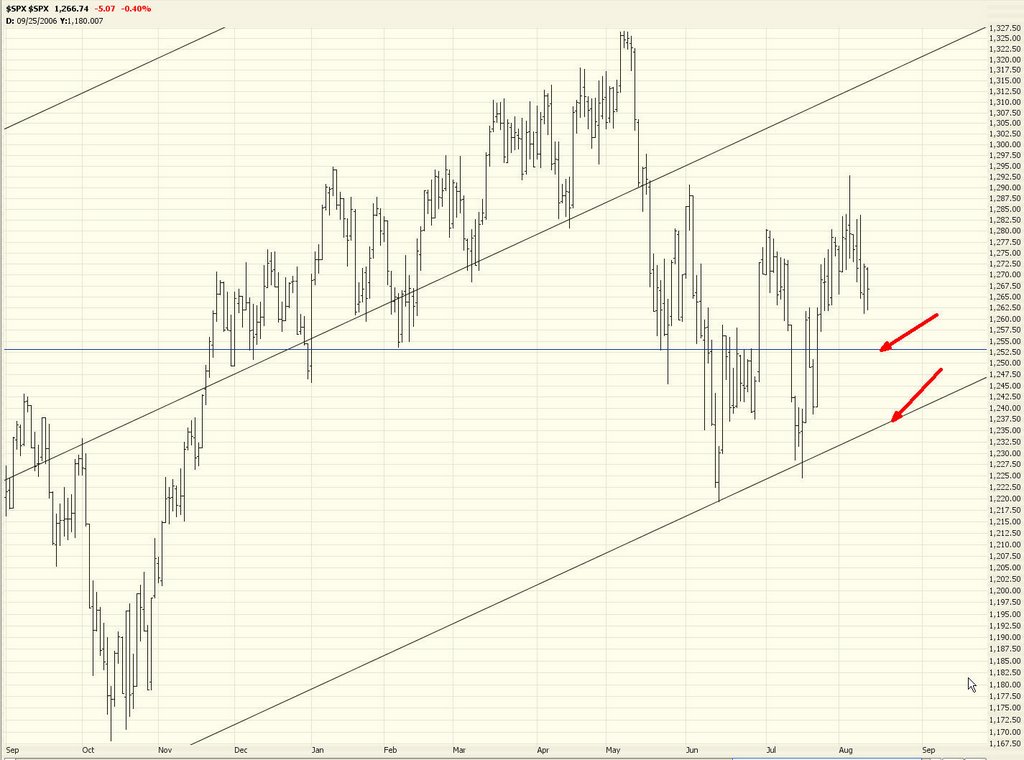
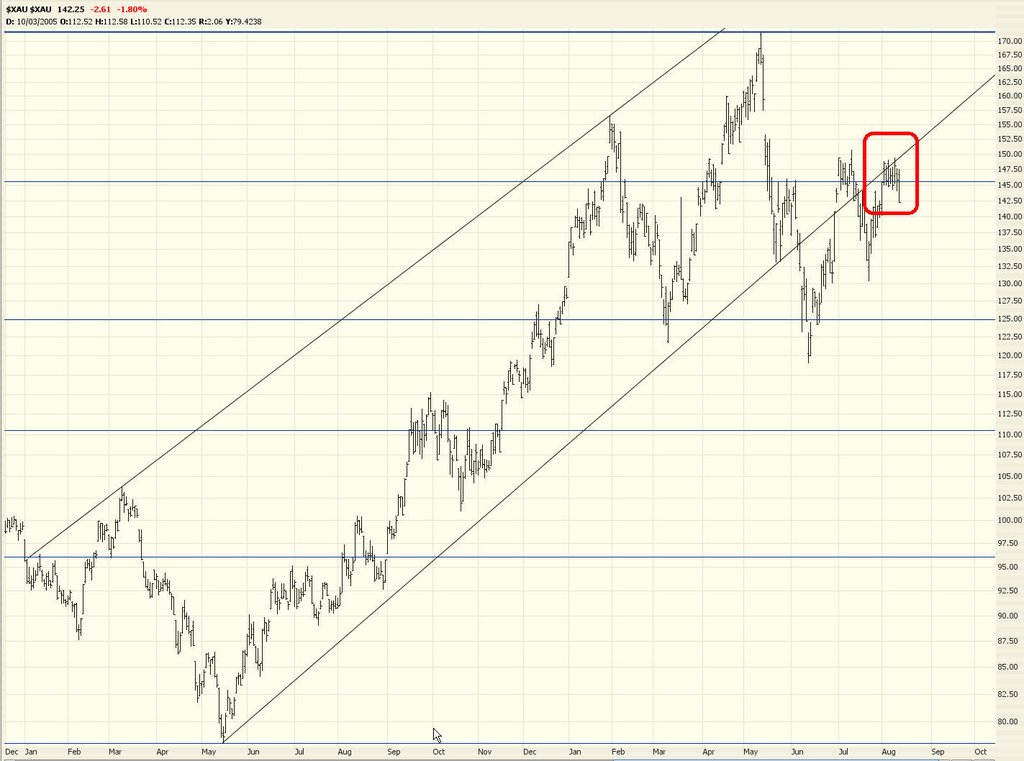
Here is a heavily marked-up S&P 500 chart. We're still in the lower half of the channel that extends back for quite some time. I'm not exactly sure what to make of this graph, except that it sure was more fun to be a bear from June 1 to July 15 than it is now. |
|
|
 [复制链接]