- 金币:
-
- 奖励:
-
- 热心:
-
- 注册时间:
- 2006-7-3
|
|

楼主 |
发表于 2009-5-10 18:02
|
显示全部楼层
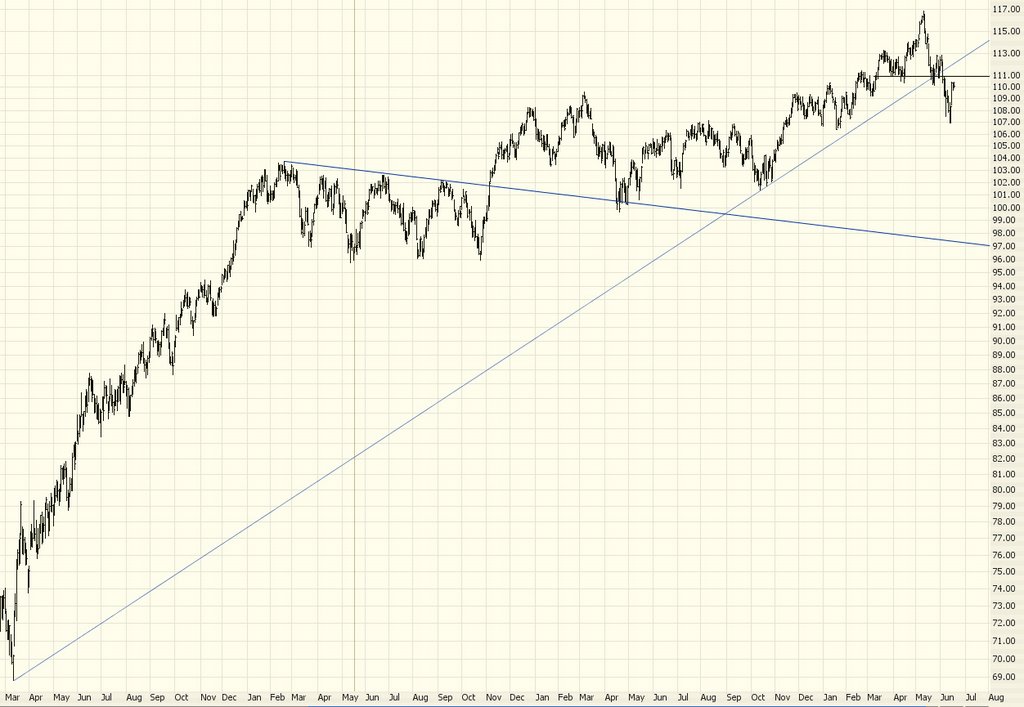
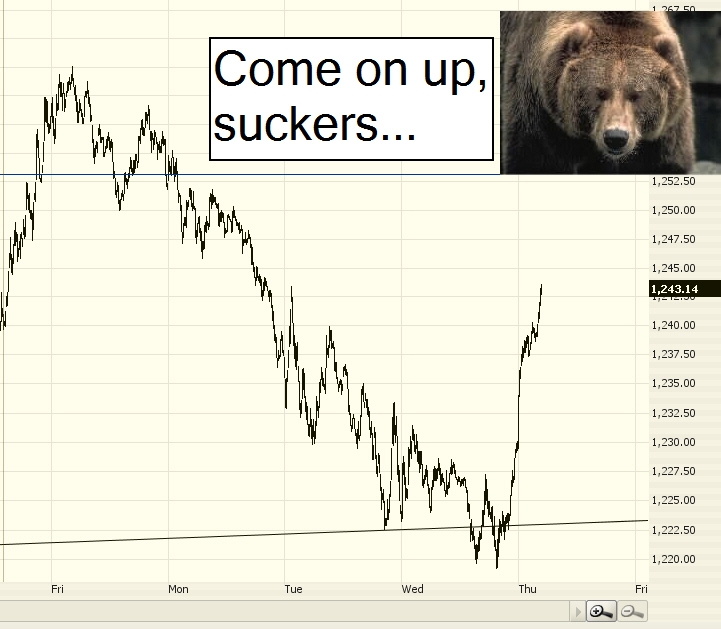
Wednesday, June 21, 2006Ouchie!
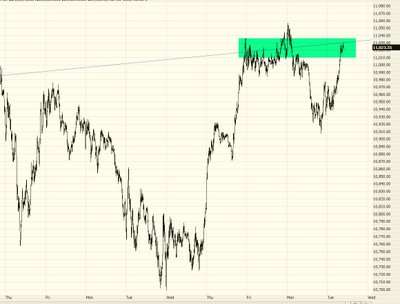
Well, the baton has been passed (for the moment) to the bulls. If you think this is a one-day wonder, you might consider the DIA puts with a stop at 112.85 (I've put in green the retraced H&S pattern below). But, make no mistake, this day belongs to the bulls, and it could be the start of a multi-week lift. We'll drill down into it deeper tonight.

at 6/21/2006 46 insightful comments
 Links to this post Links to this post
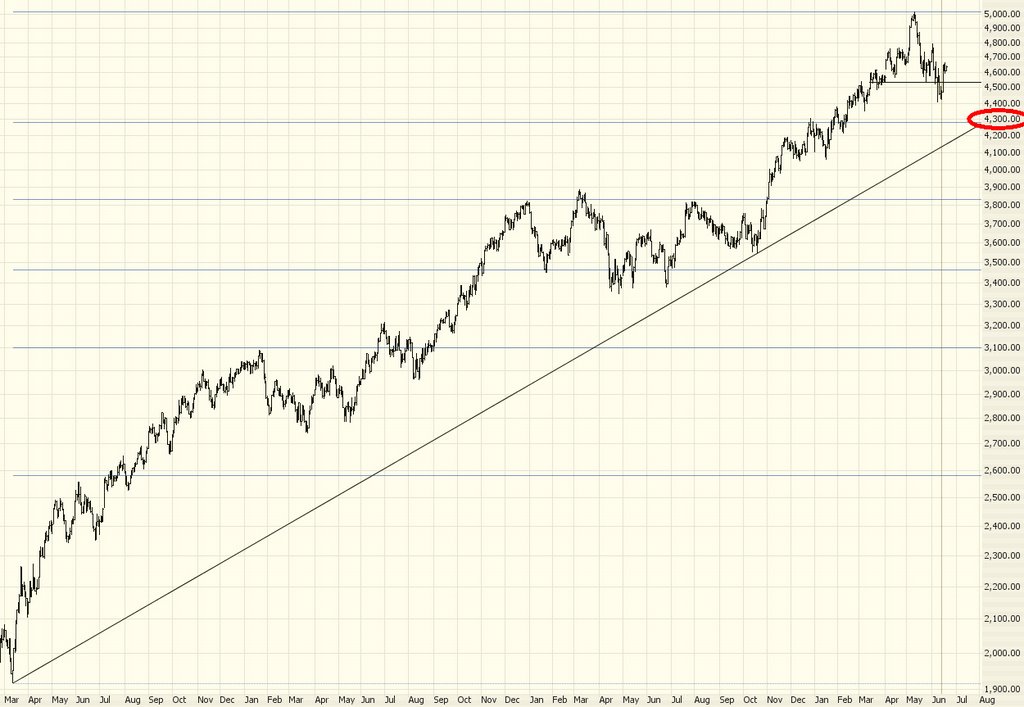
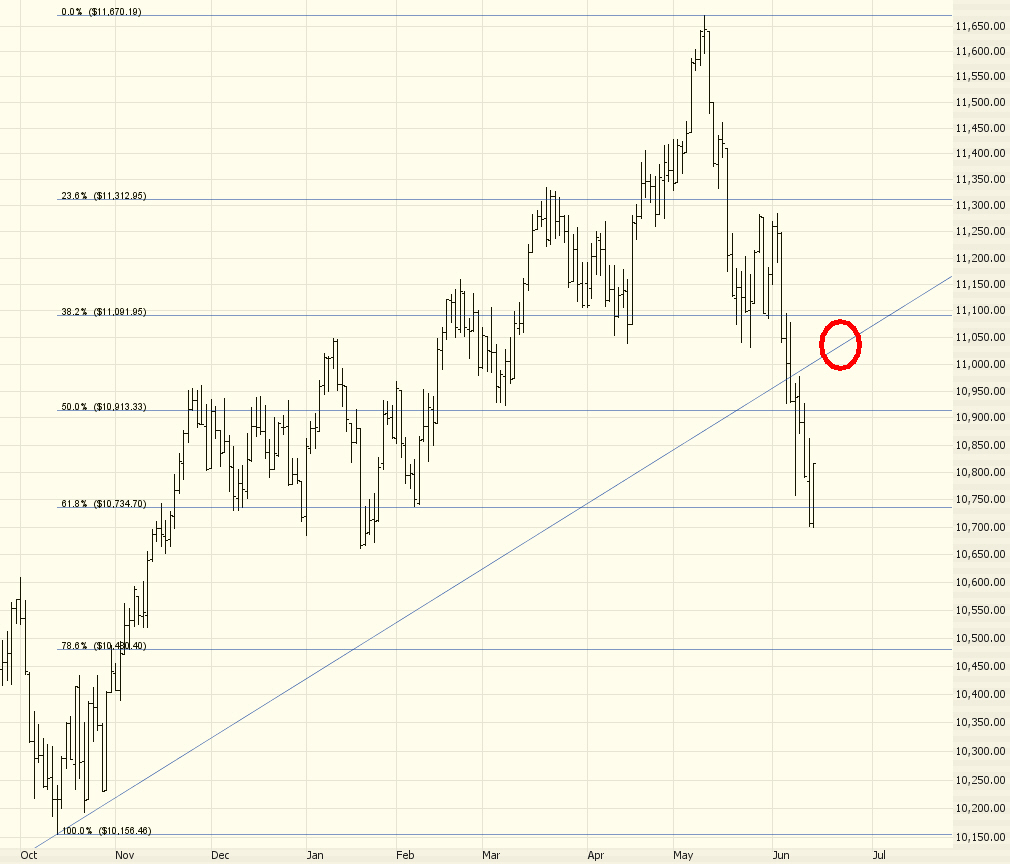
Tuesday, June 20, 2006Crossroads Again
Greetings from bucolic Palo Alto, California.
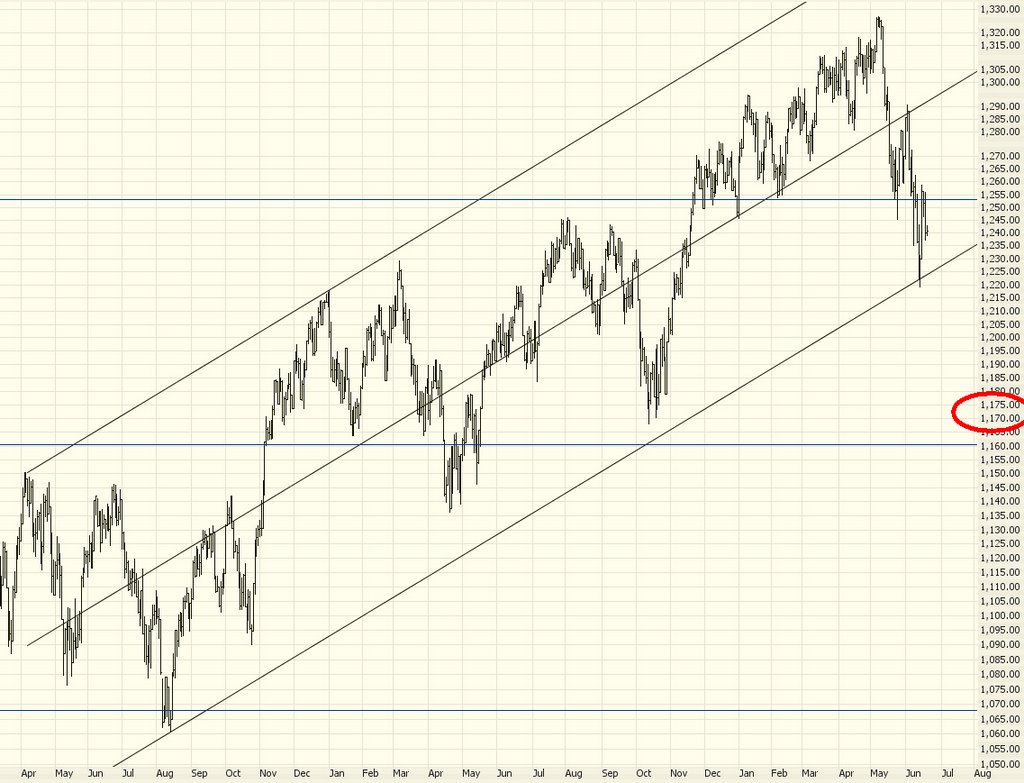
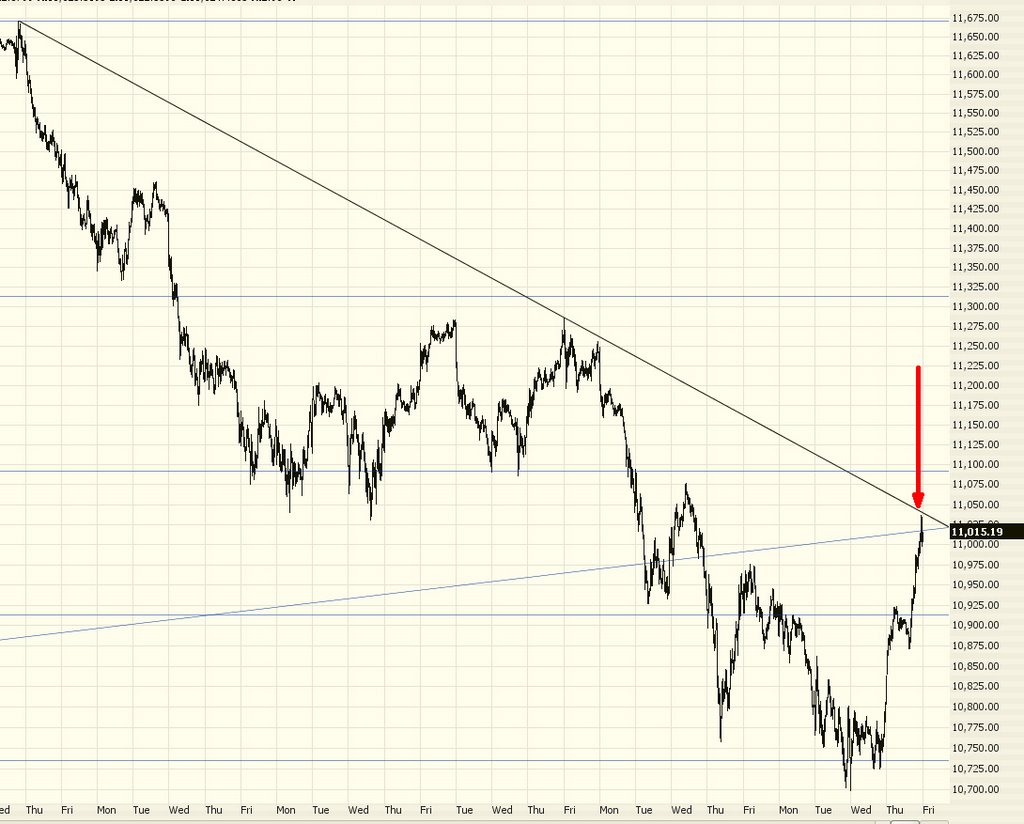
It seems the Dow is clinging to its former support (now resistance) line once again like a magnet. To 99% of the population, the market is having a great day. To those armed with good charts, it's clear to see we're simply at a crossroads again, where it's unclear whether bulls or bears are going to own the short term future.
In the recent past, the Dow's attempt to break out (followed by a failure) has been a critical component to the downdrafts we've been enjoying. The Dow moving above 11,057 would change my tune for the short-term.
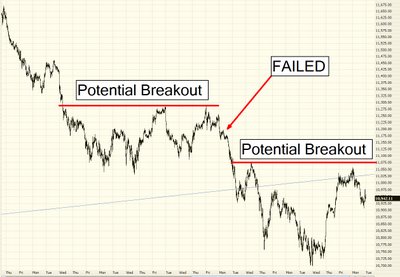
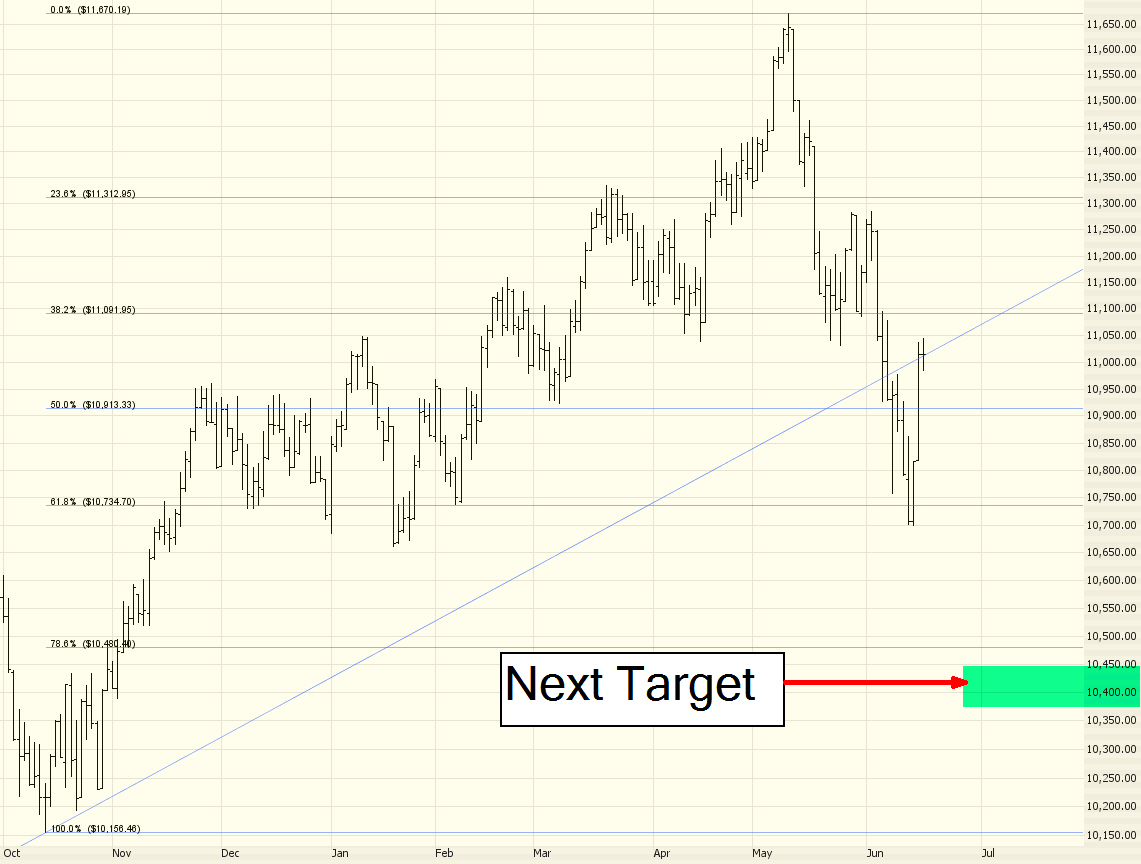
If this micro-rally fails and we bust through last week's lows, I'd say the next target for the Dow is about 10,450. |
|
|
 [复制链接]