- 金币:
-
- 奖励:
-
- 热心:
-
- 注册时间:
- 2006-7-3
|
|

楼主 |
发表于 2009-5-11 06:42
|
显示全部楼层
Monday, May 15, 2006Waiting for History to Repeat Itself
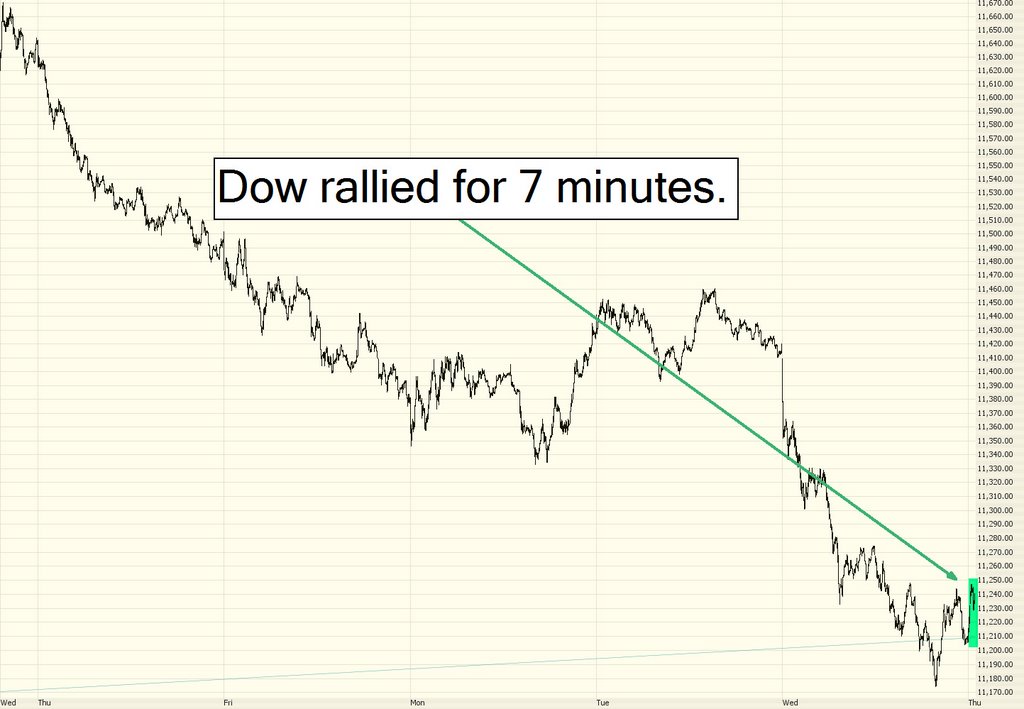
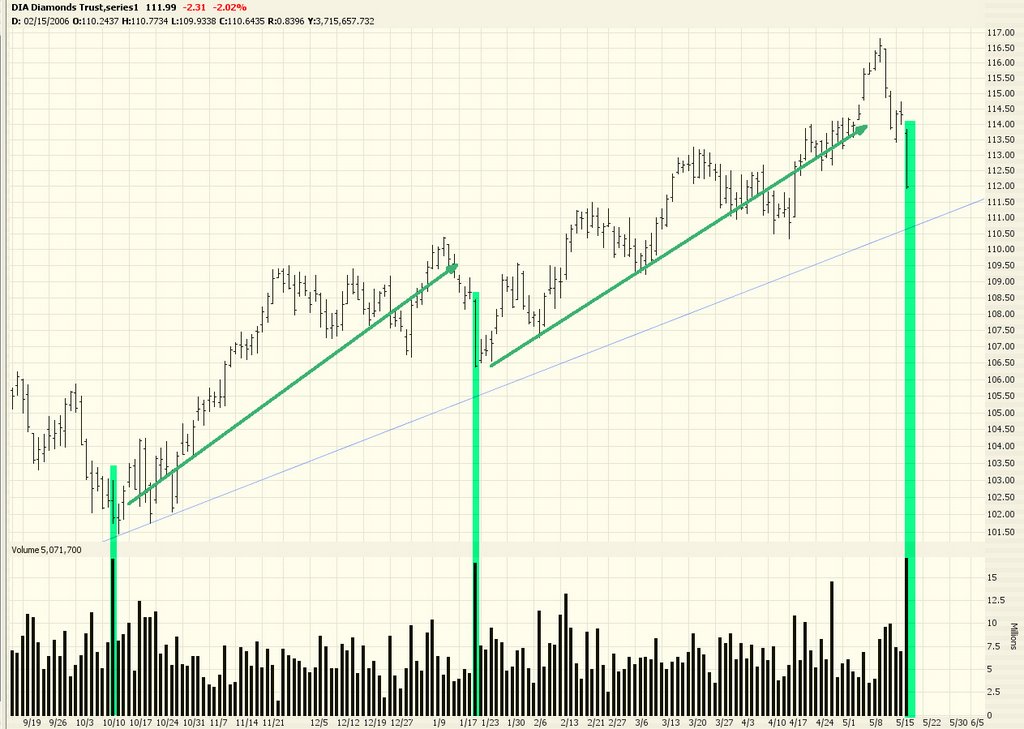
Today was pretty much exactly the kind of day I expected after two big down days on Thursday and Friday: that is, an initial descent, some gnashing of teeth while the market tried to figure out what to do with itself, and then finally an ascent on the part of the Dow 30. The major financial sites predictably responded with the swift "recovery" of the market.
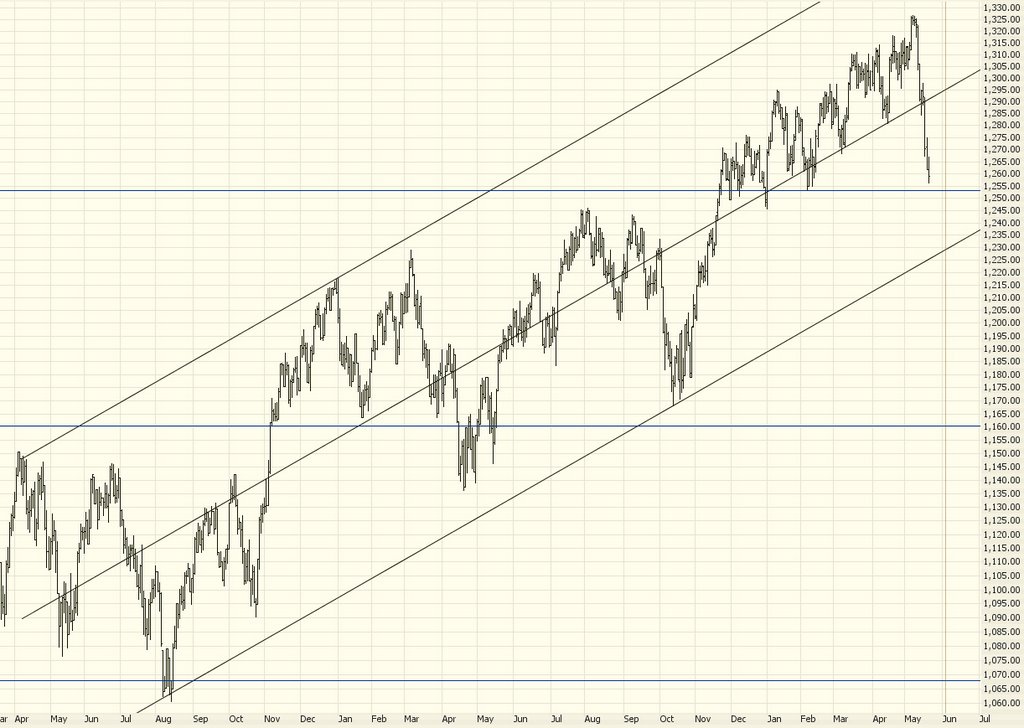
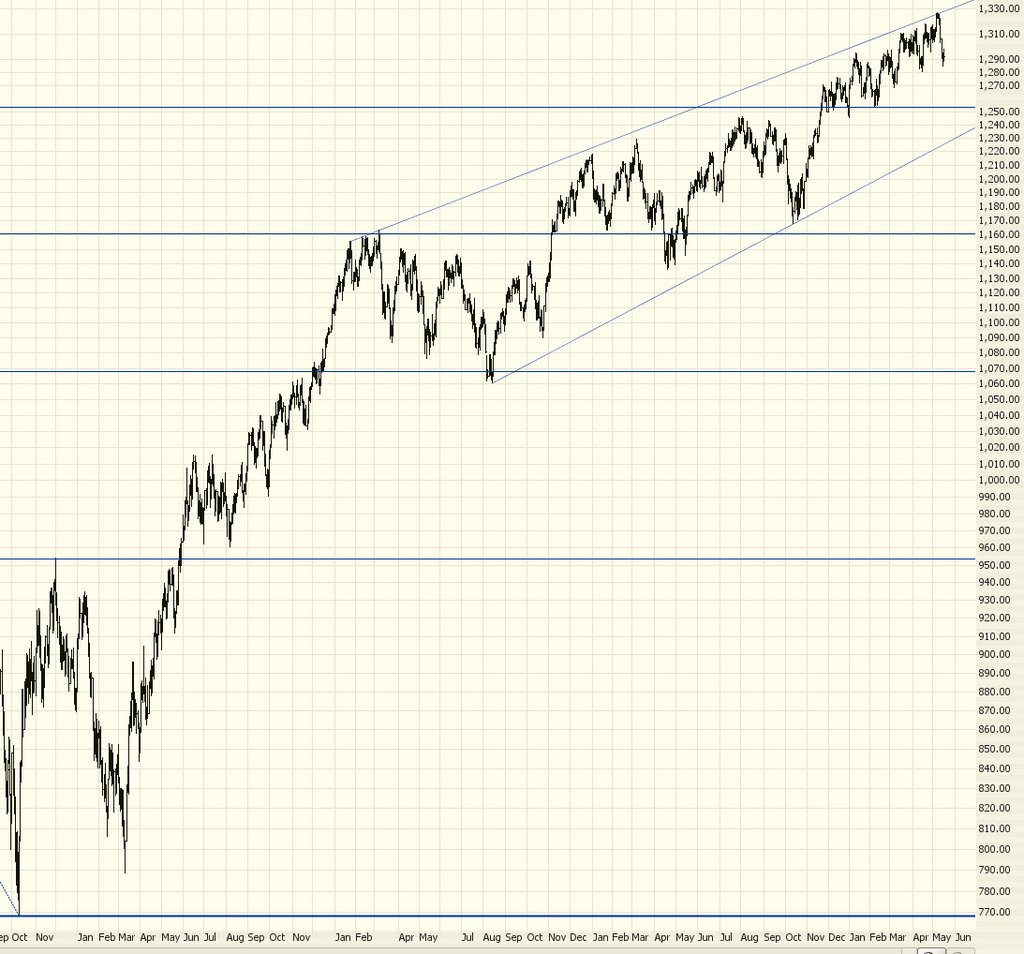
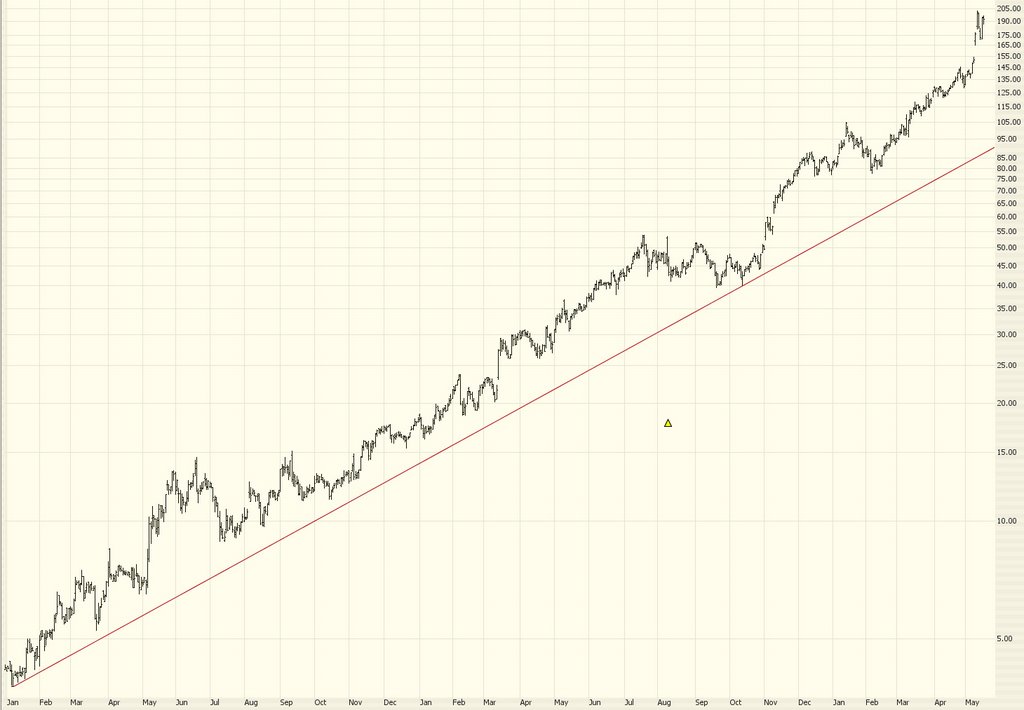
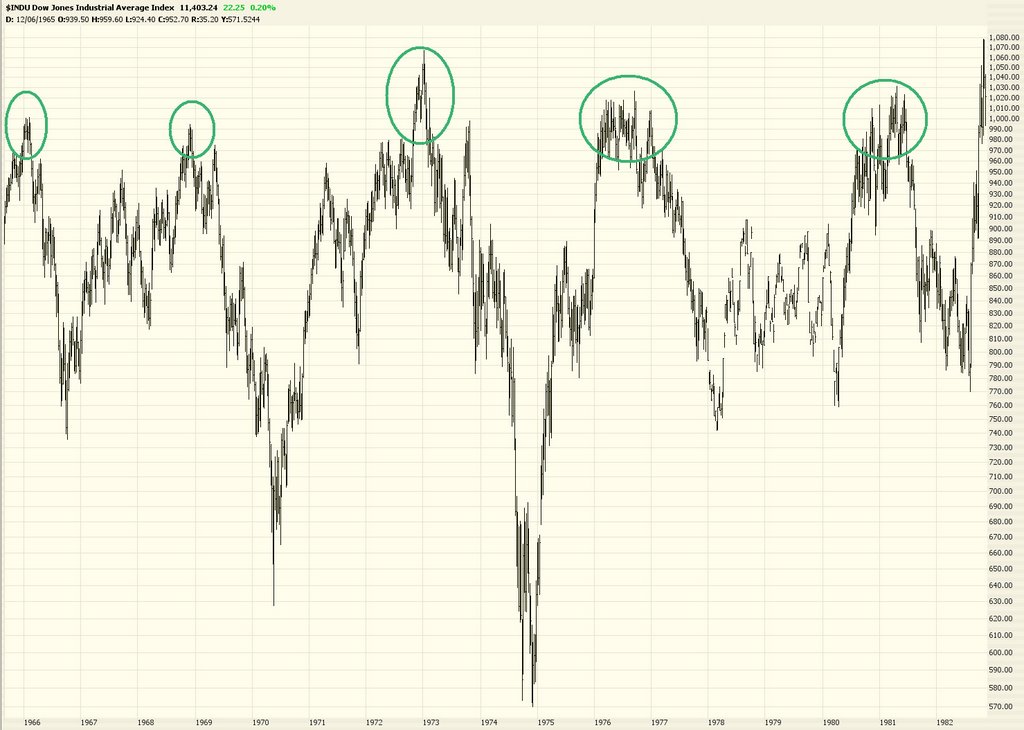
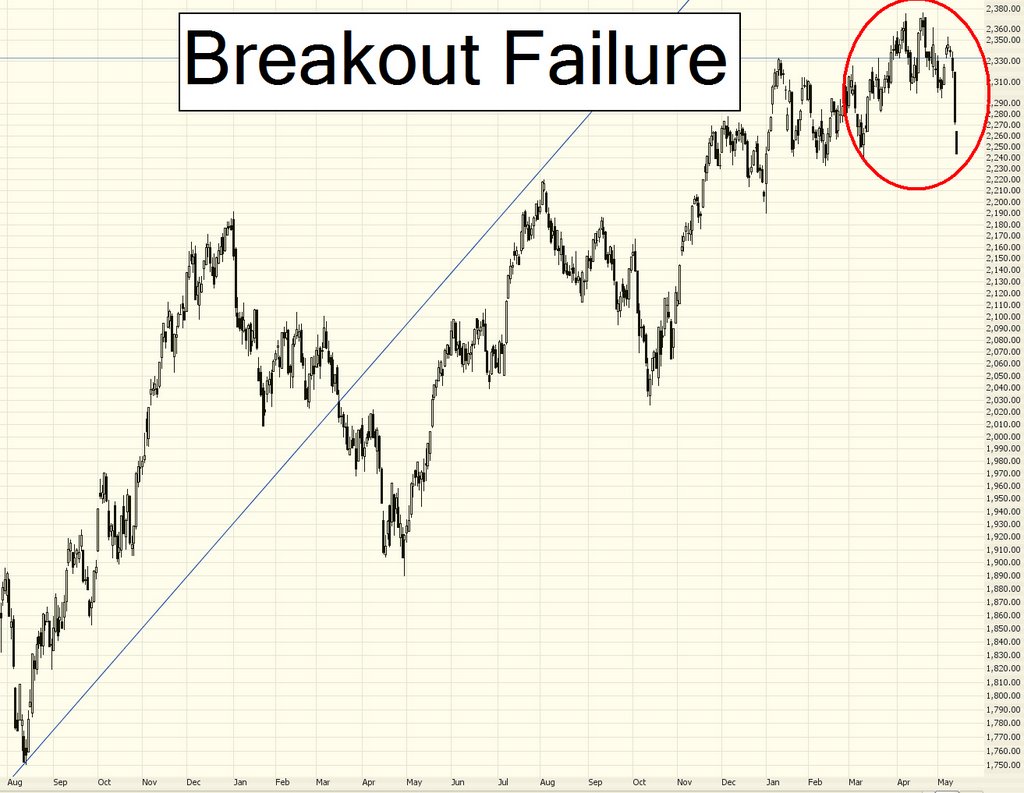
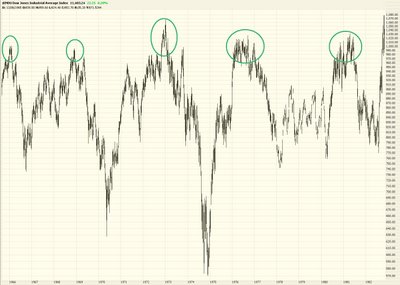
The kind of market I think we're in now is reminiscent of the one shown below - from 1966 to 1982. During that very long period, there was a fixation on "Dow 1,000". As you can see, the market hit that point again and again, only to fall from it each time. These days, the fixation is more oriented toward making a new lifetime high on the Dow. We got extremely close on May 10, but I suspect we're in the throes of what could be another major selloff. Whether or not the Dow has enough gas in it to cross the finish line or not remains to be seen. But compare this graph:
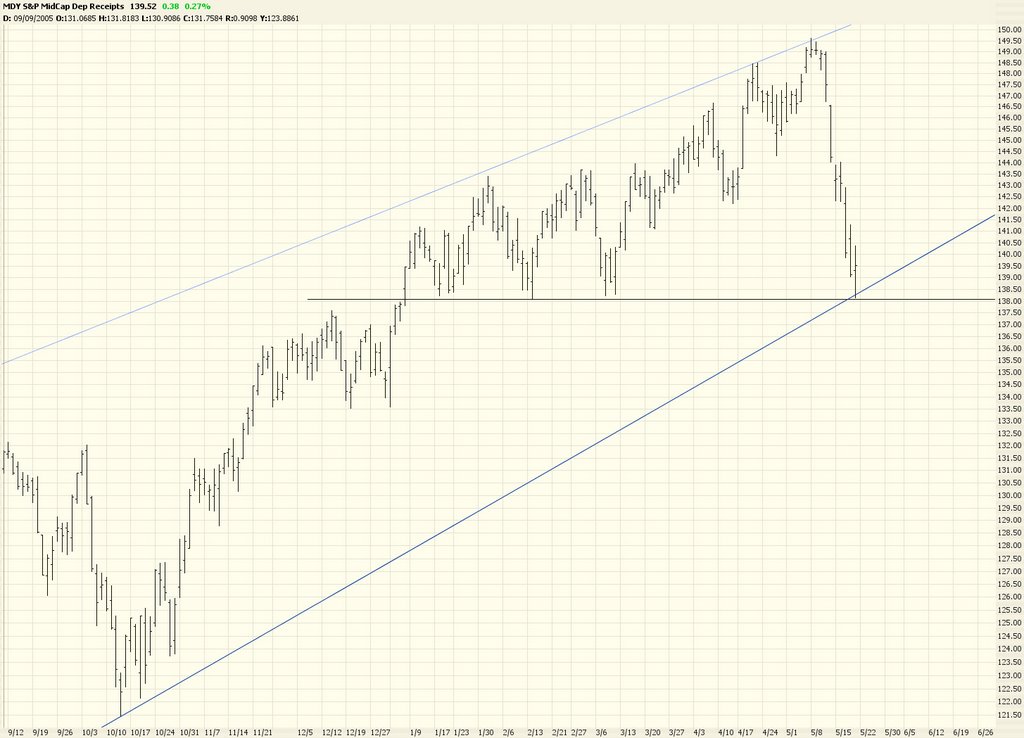
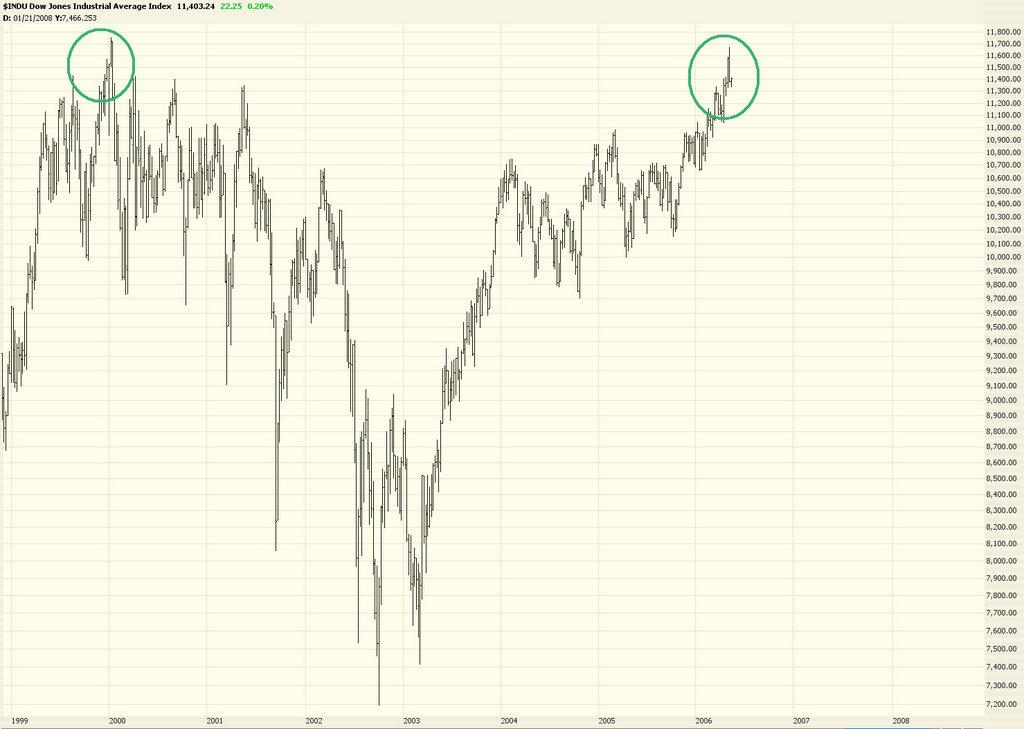
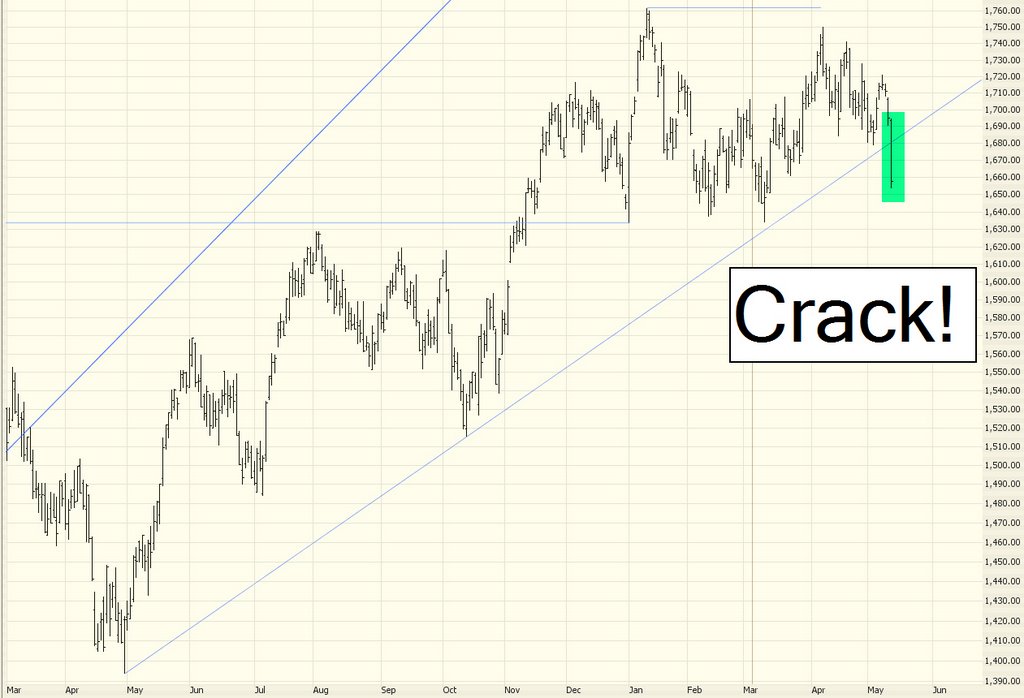
......with the more recent Dow. As you can see, the possibility that we're in the first few years of an incredibly length range-bound market is clear.

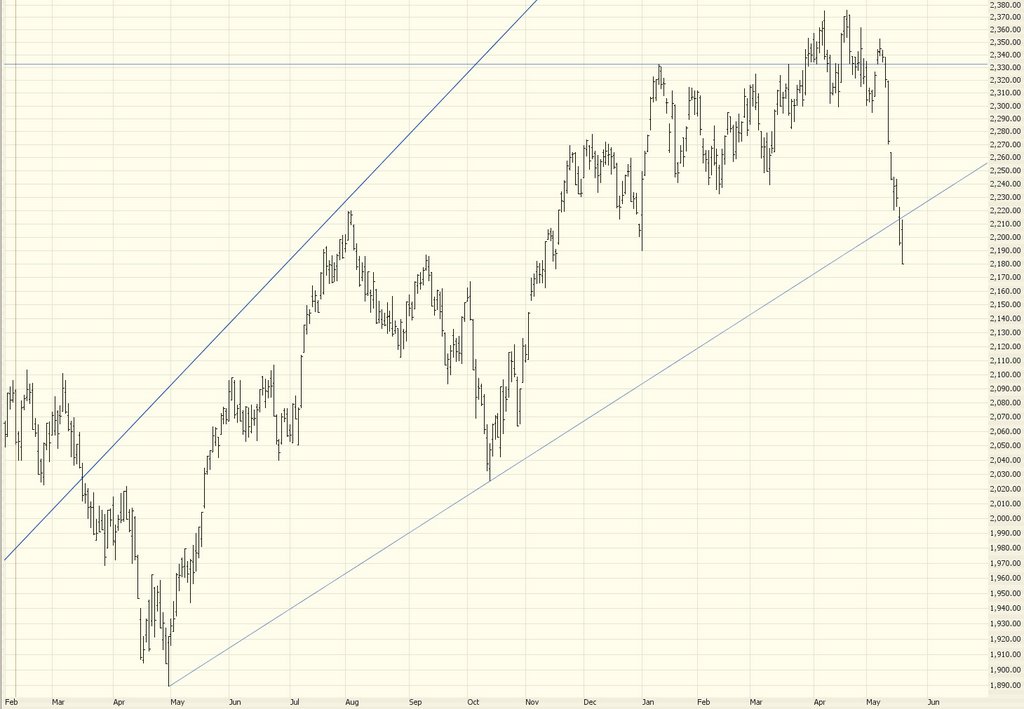
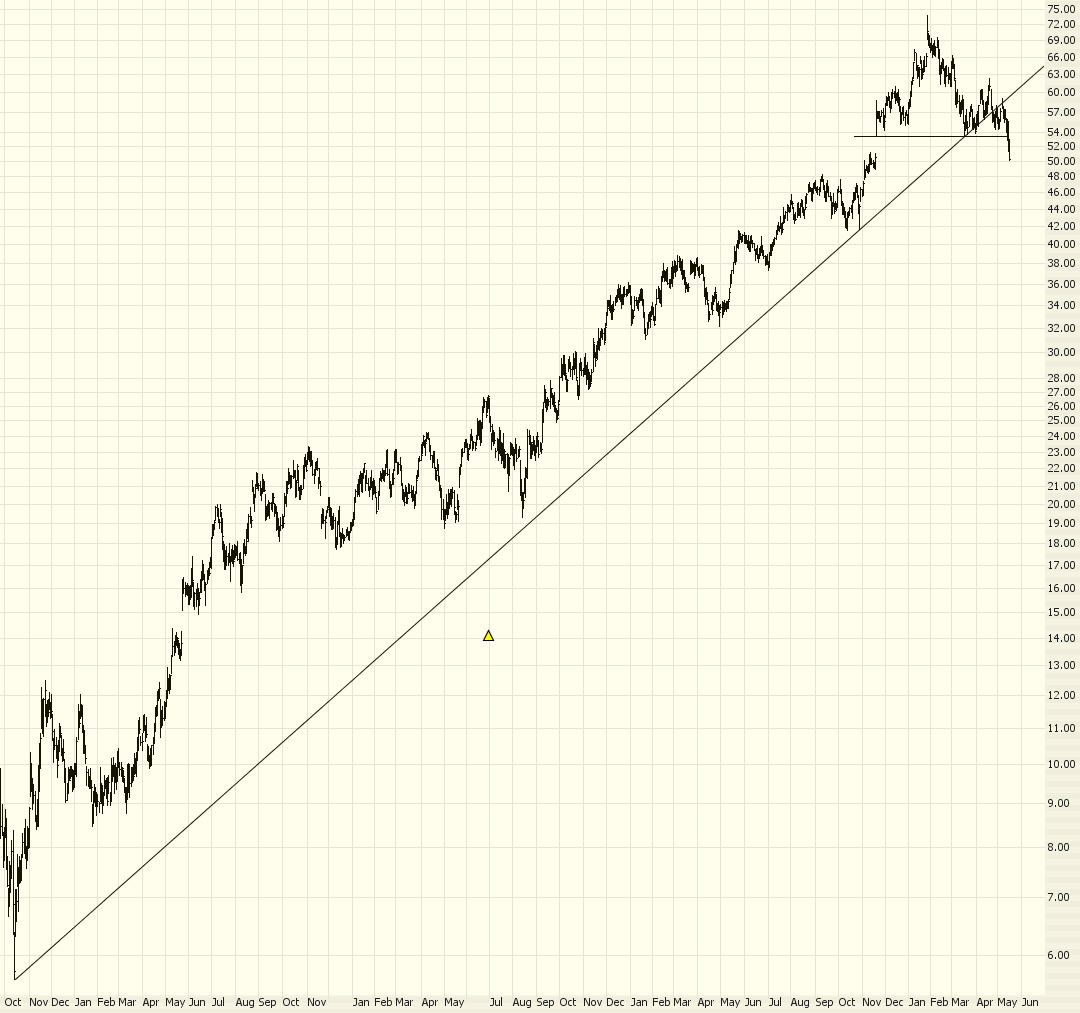
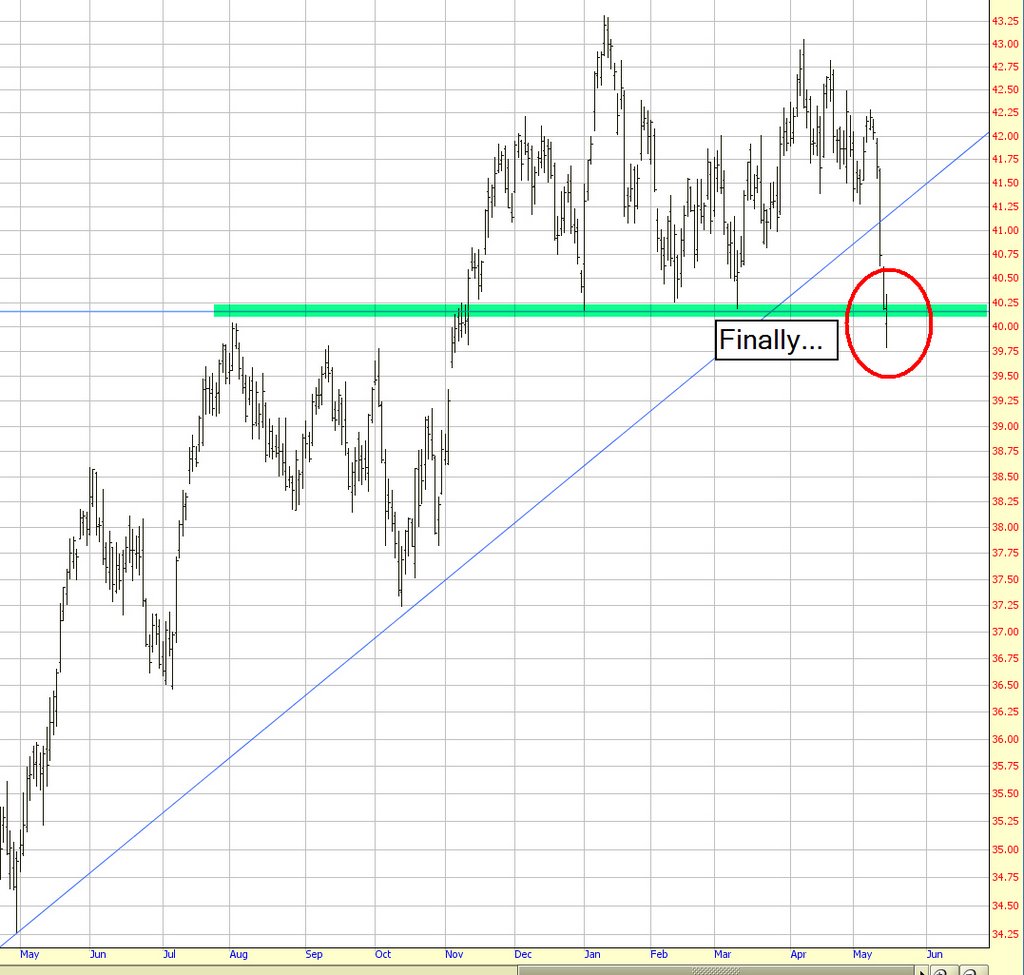
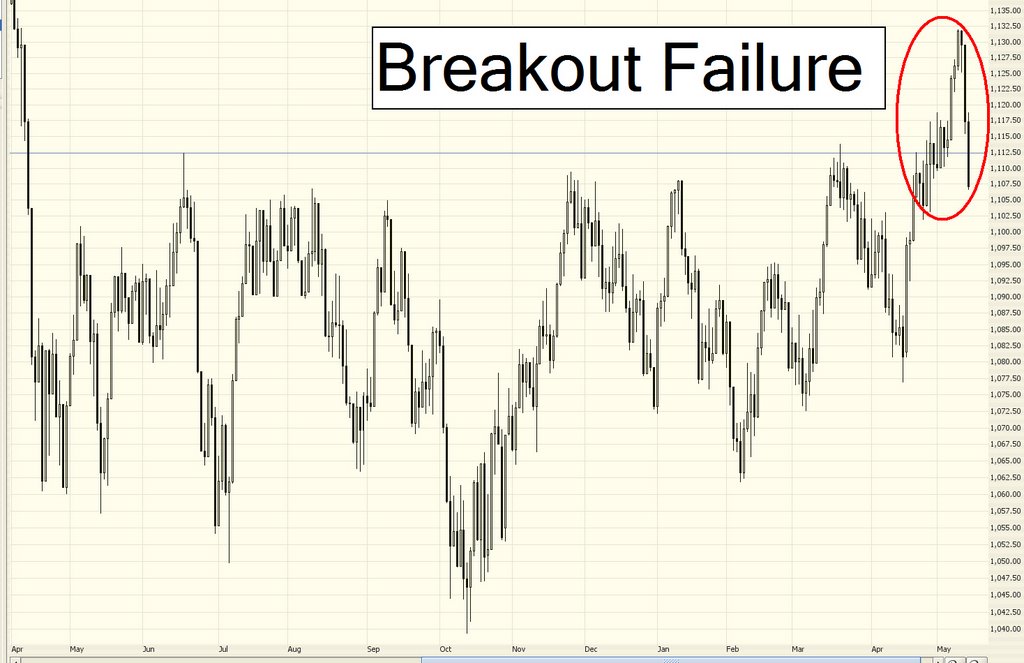
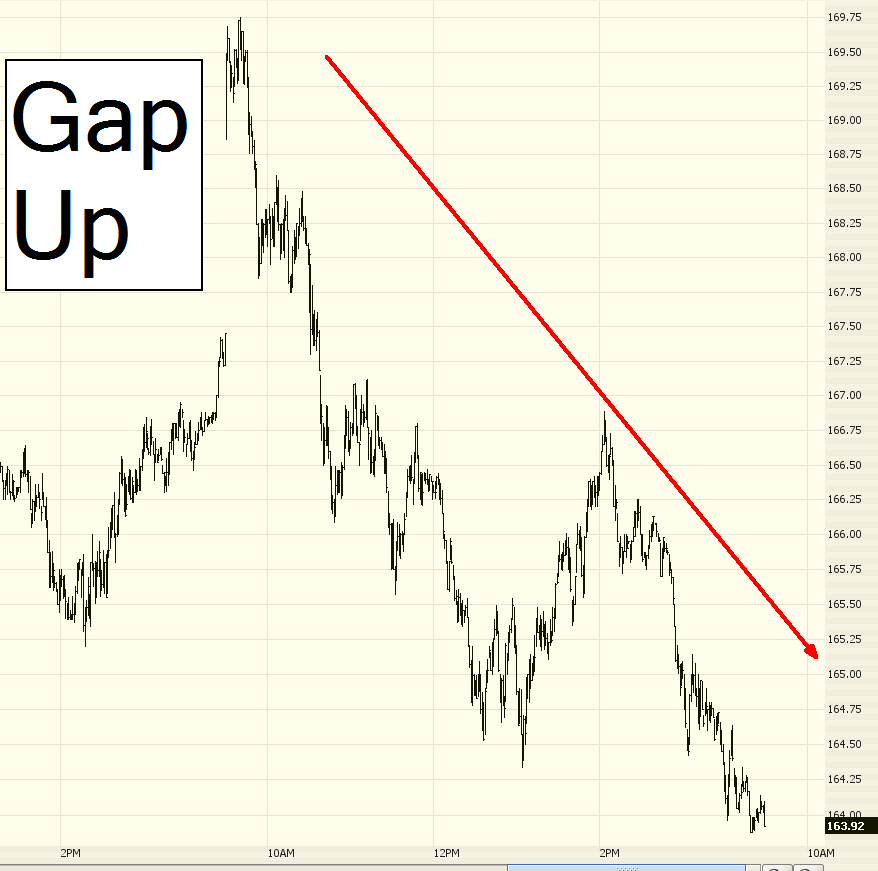
The NASDAQ 100, which has been quite weak lately, fell through an important support level today. Once the markets do resume their weakness, I imagine the NDX will be especially weak. This support level was quite important, and now it's gone.

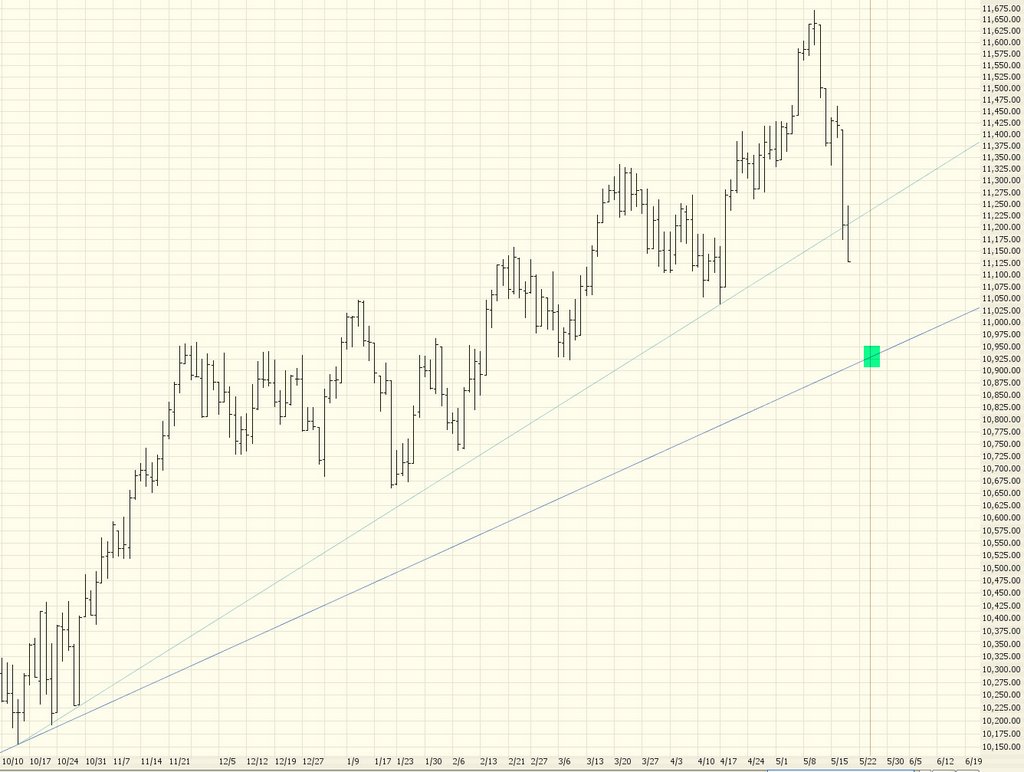
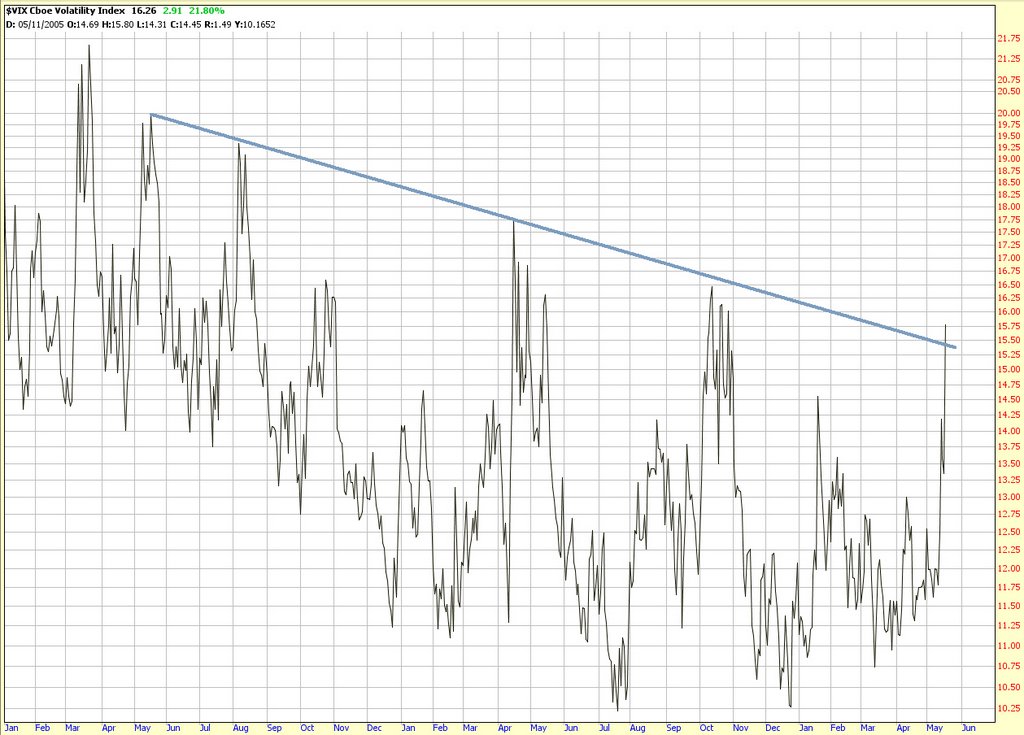
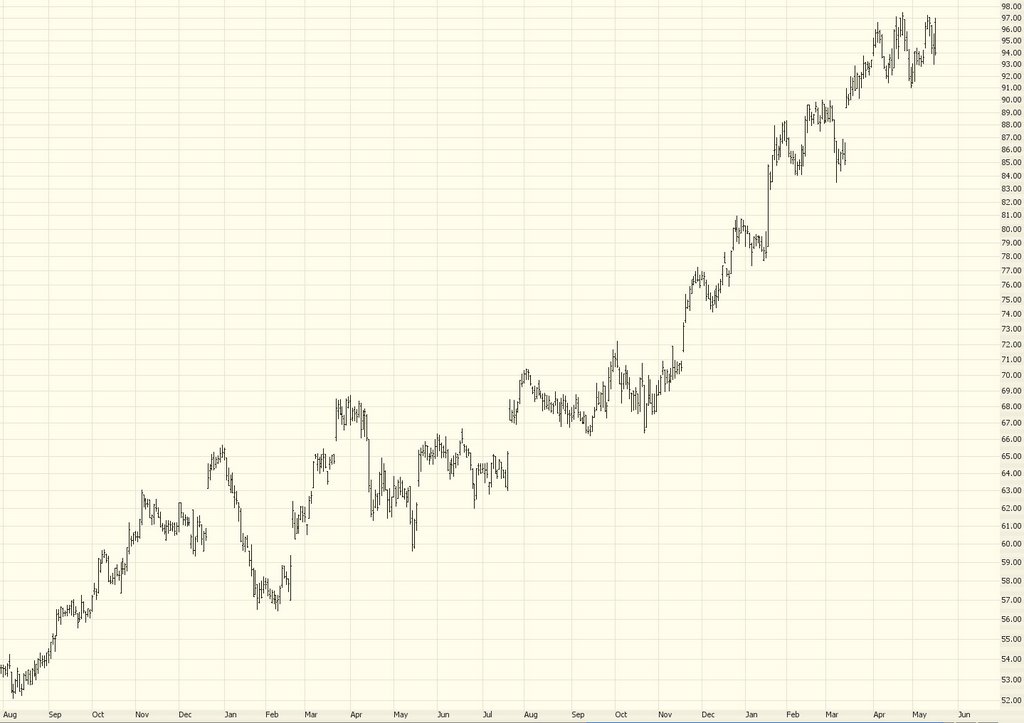
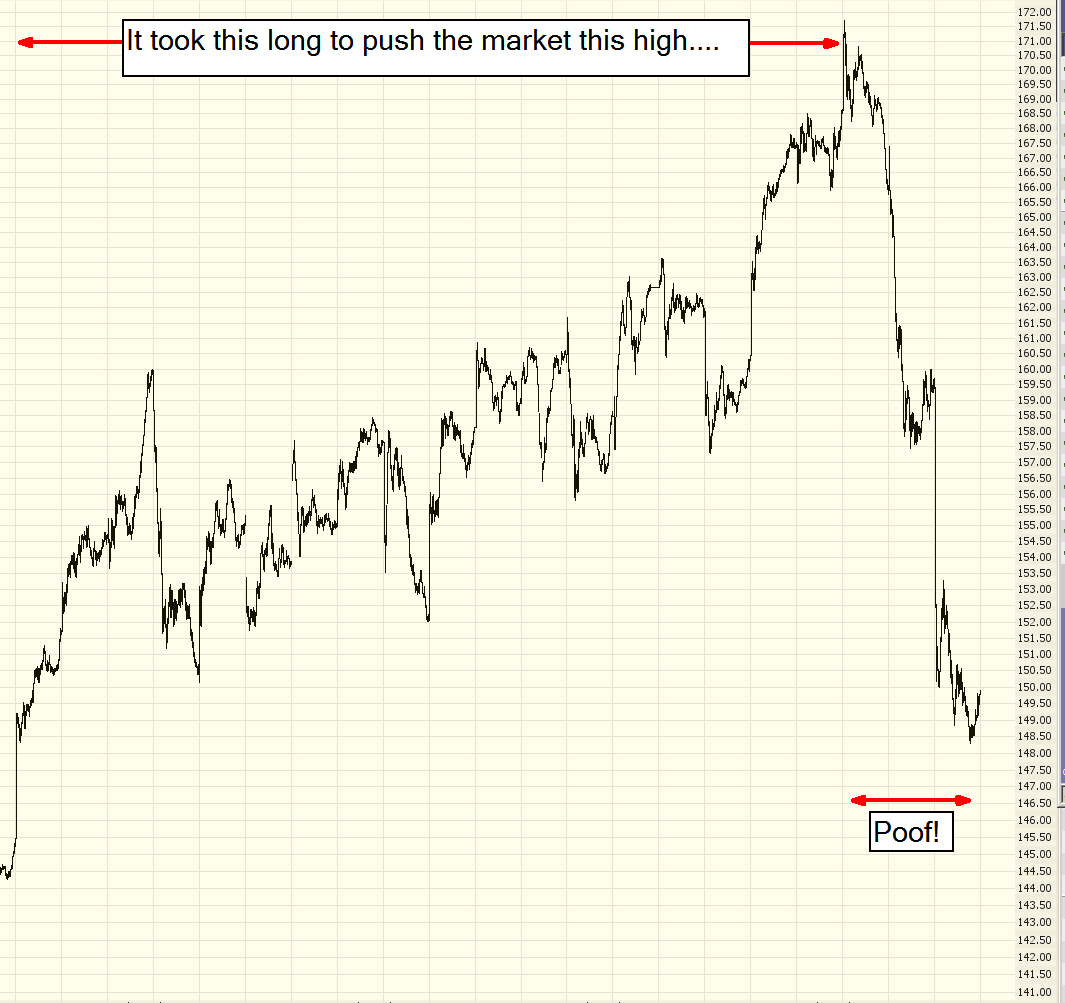
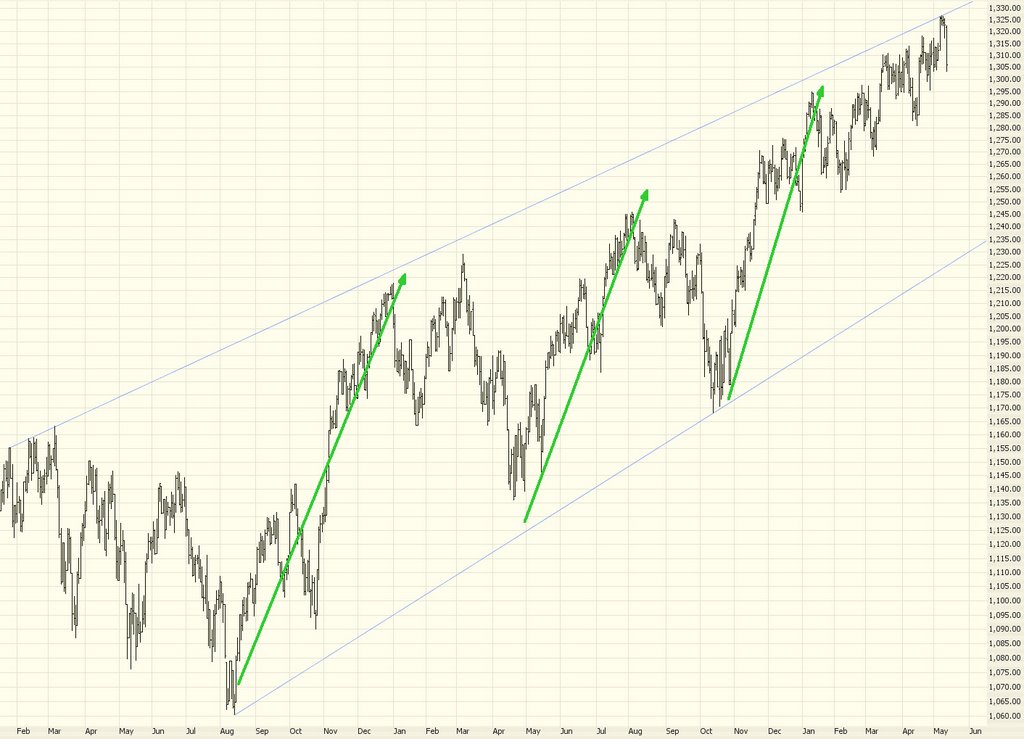
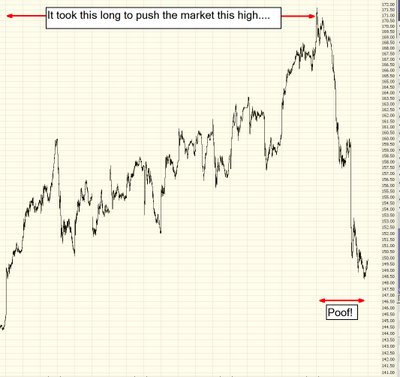
Part of the reason for the market's weakness today was that recent hyperbolic markets (Gold, Silver, Crude Oil, Copper, etc.) got blasted. What's great about being a bear in any market is that drops in price usually come much faster than rises. Take a look at this chart - it took just over a couple of days to erase the gains which took weeks to establish in the first place.
I think if you'll look back over last week's recommendations, you'll see virtually all winners. At this point, I've scaled back quite a bit, as I'd prefer to re-enter positions at better prices than these, particular in the energy markets. See you tomorrow, everyone!
at 5/15/2006 2 insightful comments
 Links to this post Links to this post |
|
|
 [复制链接]